Believe it or not, the Arizona Fall League is a place where players other than Tim Tebow go, to refine their skills before making it to the bigs. When they aren’t faith healing fans who have fallen ill, AFL pitchers are throwing a repertoire of pitches that they hope will propel them to the next levels of their minor league careers. Luckily for us, MLB has put out the pitchf/x data from the past 2 seasons (with the 2016 data coming). This allows me to calculate pitcher’s Stuff from the AFL.
The Stuff metric has been closely related to a lot of performance metrics at the MLB level – but I have not had a chance to look at any minor league data, until this point. I wanted to see how Stuff in the AFL compared to MLB Stuff – and to see if this has any potential as a scouting metric in parks that have PitchF/X. Let’s compare.
Methods
I used the calculated Stuff metric from the 2016 as my MLB standard. The stuff list is the same one found on www.mikesonne.ca. I downloaded the PitchF/X outputs from Baseball Savant (for the 2014, and 2015 AFL seasons), and calculated Stuff in the same way mentioned here. To try and get some sort of consistency, I only calculated stuff for pitchers that threw 30 pitches in the AFL. Additionally, pitchers had to have thrown at least 10 innings in the MLB in 2016. For analysis, I compared the 2016 Stuff against the AFL stuff using a Pearson’s correlation coefficient.
Results
First off, from the 116 different pitchers that had PitchF/X data in the AFL, only 23 managed to fit both inclusion criteria. The average fastball velocity, offspeed velocity, change of speed, and break distances, as well as correlation coefficients can be found in table 1.
Table 1. Summary of variables from AFL and MLB.
| Stuff | FB Velocity | Offspeed Velocity | Change | Movement | |
| AFL | 0.31 ± 0.91 | 92.54 ± 3.07 | 81.38 ± 4.77 | 0.12 ± 0.04 | 9.65 ± 6.06 |
| MLB | 0.73 ± 0.84 | 93.37 ± 3.33 | 81.18 ± 3.65 | 0.13 ± 0.03 | 13.74 ± 4.12 |
| r | 0.59 | 0.85 | 0.67 | 0.5 | 0.33 |
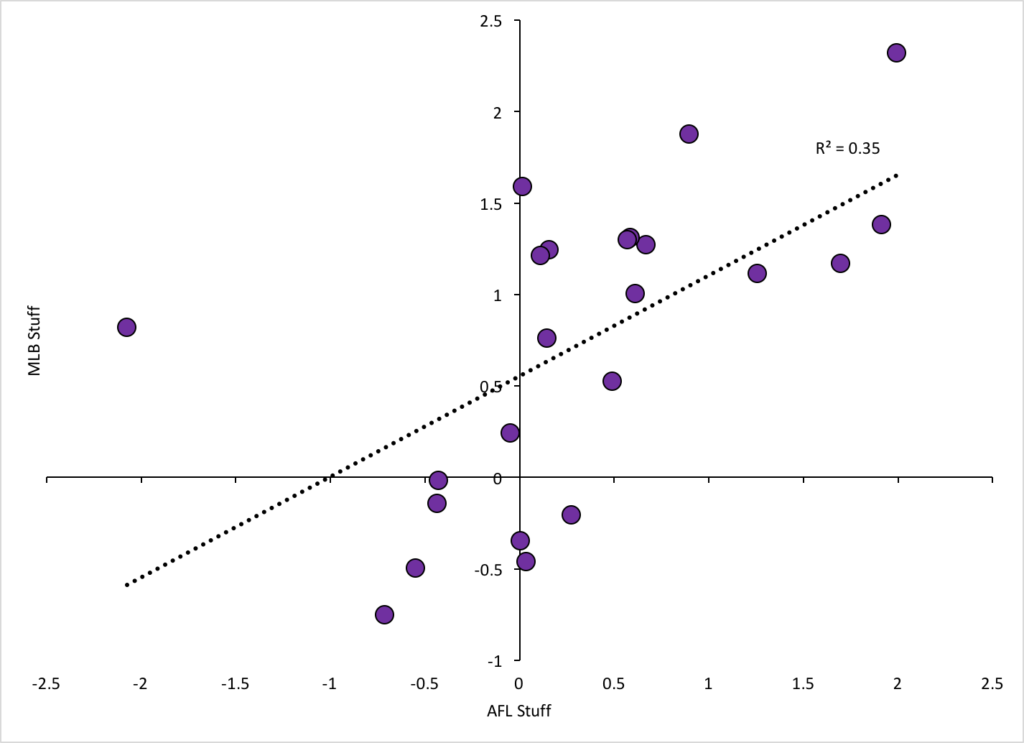
| r2 | 0.35 | 0.72 | 0.44 | 0.25 | 0.11 |
All components of the Stuff metric correlated well between AFL and MLB measures. Velocity had the strongest relationship (r = 0.85) between the measures at the AFL and MLB. Movement had the weakest relationship (r = 0.33). Overall, AFL stuff accounted for 35% of the variance in MLB stuff. Not great, but definitely a good start. This is really a small sample size, and if we omit the data from one outling pitcher (Adam Morgan), the r value goes up to 0.77.
The PitchF/X system can be a bit finicky, so there’s a chance that some of the movement data discrepancies are a factor of the different parks in the AFL. Maybe these cameras weren’t as sensitive to the pitch movement, or maybe, the pitchers at this time in their development, weren’t as good at generating movement.
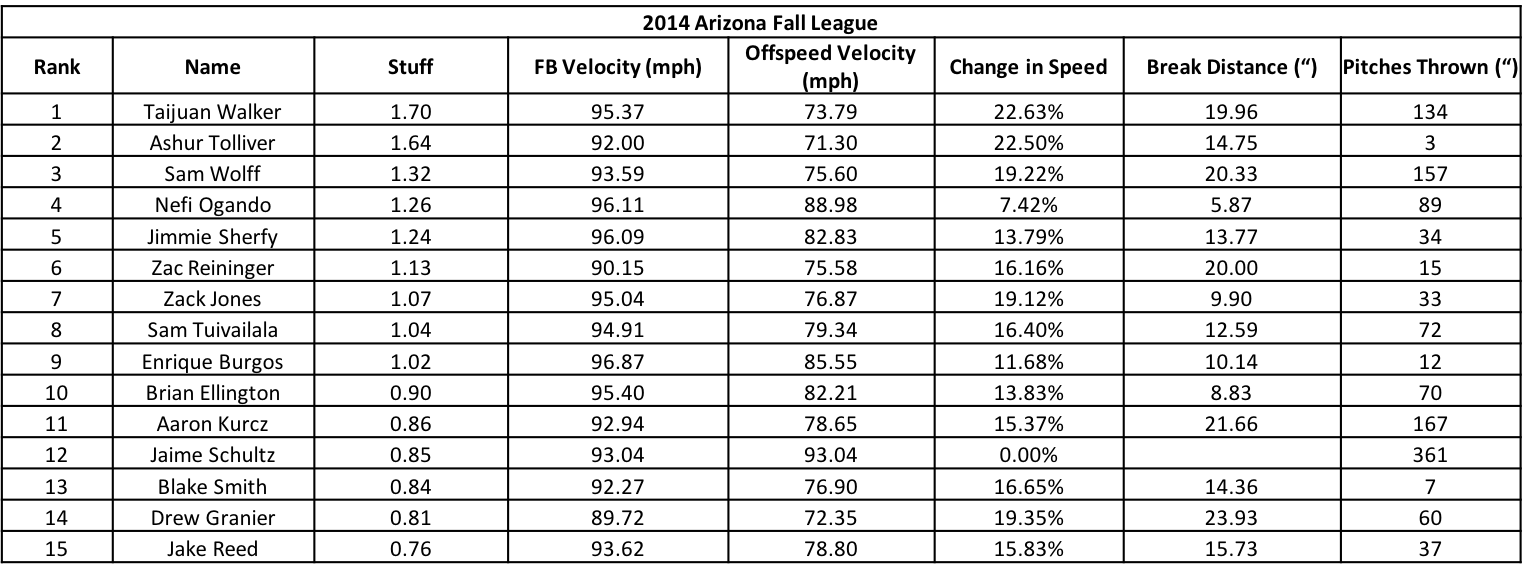
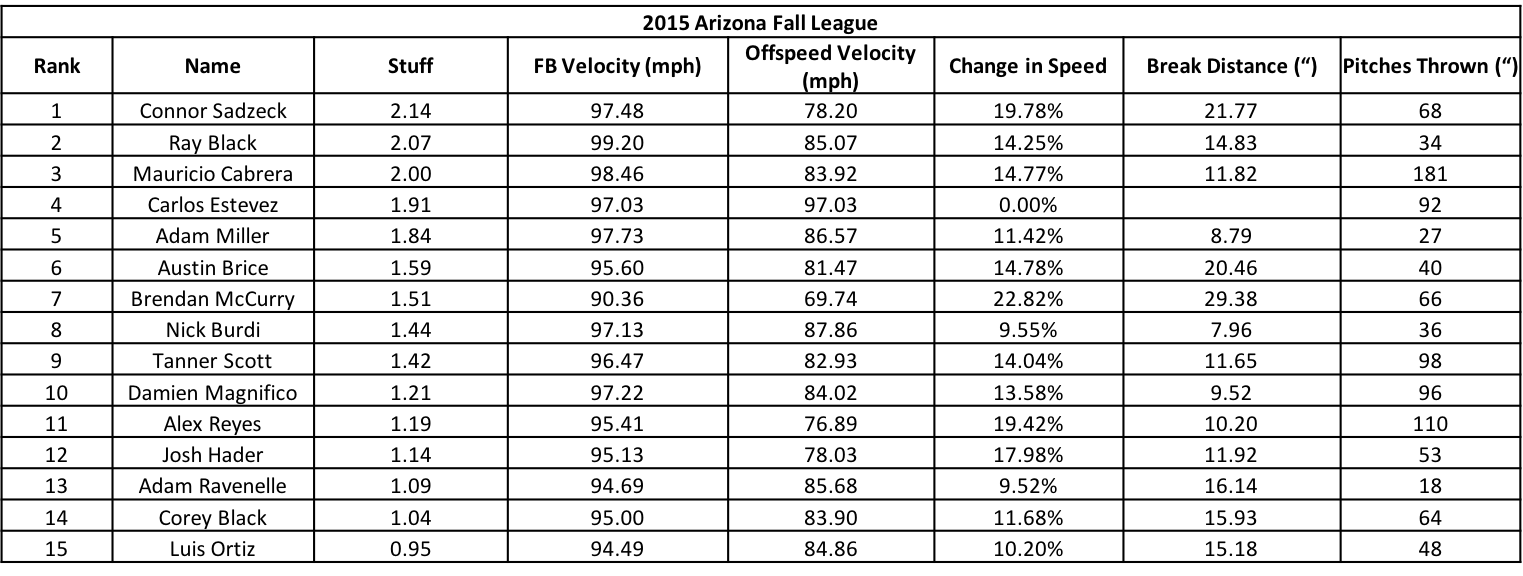
Here are the top 15’s for the 2014, and 2015 AFL’s
In summary – there is a decent relationship between AFL and MLB Stuff – it isn’t perfect, but this could be used as a possible way to track pitcher development, and another tool for evaluating Stuff prior to arriving in the MLB. Right now, there aren’t enough pitchers from the AFL who have made their way to the MLB to truly get an idea of how their Stuff develops – but this is an encouraging start.
Now, if we can just go back to watching more Tebow…

Recent Comments