When you watch football, it’s very clear by body type, what position a player likely plays. Are you 6’5 and 320lbs? That’s more than likely a lineman. 5’9 and 210 lbs? Chances are, you’re a running back. Baseball is a lot different – Marcus Stroman (5’8, 180lbs) and Chris Young (6’10, 255lbs) play the exact same position. Chris Sale (6’6, 180lbs) and Bartolo Colon (5’11, 285 lbs (sure… I believe you)) also play the same position. There aren’t too many times on the gridiron where a 100lb weight difference will line up against each other!
The point I’m trying to make, is with such huge variances in body shapes and sizes, there are many different ways to skin a cat. Marco Estrada (of 89 mph fastball fame) was massively more successful than Joe Kelly (punching a fastball in the high 90s, and over 100 mph). Pitchers of all shapes and sizes (of body and fastball) find ways to succeed. The question is – when you don’t have the clearly obvious advantage of that big fastball, how do you get major league hitters out?
Last week was pitching week over at Baseball Prospectus, and they revealed two new awesome statistics. The first one was Called Strikes Above Average: an attempt to quantify command (Long et al., 2017a). It reflects the ability for a pitcher to hit his spots and get strike calls. The second one was tunneling – a concept I tried to include in the Stuff metric by calculating the resultant distances in pitch breaks, but done in a way that is much more reflective of the demands on a hitter’s executive functioning (Long et al., 2017b). If you have studied Kinesiology, their description of tunneling, and the break:tunnel ratio is a great example of why hitting is so damned hard from a motor control perspective.
It’s pretty easy for someone to look at a pitcher, and say that they have great Stuff. Originally, I created the Stuff metric to try and win bar arguments about pitchers – it’s not necessarily shocking when you see the list of people with great Stuff. Of course Clayton Kershaw has better Stuff than Kyle Hendricks. I felt that combining the Stuff metric with these tunneling and command metrics would help better understand how pitchers of different Stuff levels ended up succeeding or failing at pitching.
Step 1
The first step was to correlate Stuff, CSAA, and Break:Tunnel with one another. I wanted to see what each metric said about the others – what did the relationship look like?
| Stuff | CSAA | Break:Tunnel | |
|---|---|---|---|
| Stuff | — | -0.41 | 0.29 |
| CSAA | -0.41 | — | -0.03 |
| Break:Tunnel | 0.29 | -0.03 | — |
From this correlation table, you can see that typically those who had better stuff had less command, but a bigger break:tunnel ratio. There weren’t really any significant relationships between command and tunnels, which is great – they’re telling us two different things.
Step 2
To look at the relationship between outcome measures and Stuff, Command, and Tunnelling, I used the same process as in the last stuff article – just as simple correlation between the three pitching variables, and the outcome metrics of Deserved Run Average, Strikeouts per 9 (K/9), Earned Run Average, xFIP, Ground Ball Rate, and Swinging Strike Rate. To keep it simple at first, I just looked at qualified starting pitchers.
| DRA | K/9 | ERA | xFIP | GB% | SwStr% | |
|---|---|---|---|---|---|---|
| Stuff | 9.7% | 18.4% | 3.6% | 9.9% | 0.3% | 11.9% |
| CSAA | 1.2% | 0.1% | 0.4% | 0.4% | 0.6% | 0.5% |
| Break:Tunnel | 0.1% | 2.0% | 0.1% | 0.2% | 2.5% | 0.1% |
Interestingly enough, Stuff was more highly correlated than command or tunnelling, for all outcome measures. Better Stuff produced a lower DRA and ERA, and a higher K/9, and swinging strike rate. There were negligible relationships with GB% and Stuff. For command and tunnels, there were very few significant relationships with the outcome measures – with there being a slightly elevated relationship between Break:tunnel ratio and K/9. So, from the simple conclusions chapter, I have the following advice for pitchers. Throw hard, and be nasty. There’s no greater individual predictor for success than blasting a ball at 97 mph past a hitter. Go and watch the movie Fastball, and look at the science behind hitting a 100 mph pitch. But then again, we all knew that, right?
So, how do the guys who don’t throw absolute gas survive in the MLB? I think these three metrics provide some really interesting insight into those survival skills.
Step 3
To put things on the same scale, I divided each metric’s range into thirds. The top third represents the most desired values (higher K/9 and Stuff, lower DRA and ERA). I then calculated the average CSAA and break:tunnel ratio by each third, which resulted in a 3×3 square. I performed this analysis with Stuff along the horizontal axis, and DRA, ERA, and K/9 along the vertical axis. I repeated this for CSAA and Break:tunnel, resulting in 6 squares. To expand this analysis to more pitchers, I set a threshold of 38.1 innings pitched in a season (and included pitchers from 2008 to 2016). The 38.1 innings limit represents the 75th %ile value for innings pitched in a season – 75% of all pitchers pitched at least this many innings in the season.
Table 3. Average Break:Tunnel Ratio, and Command metrics for Stuff, DRA, K/9, and ERA.
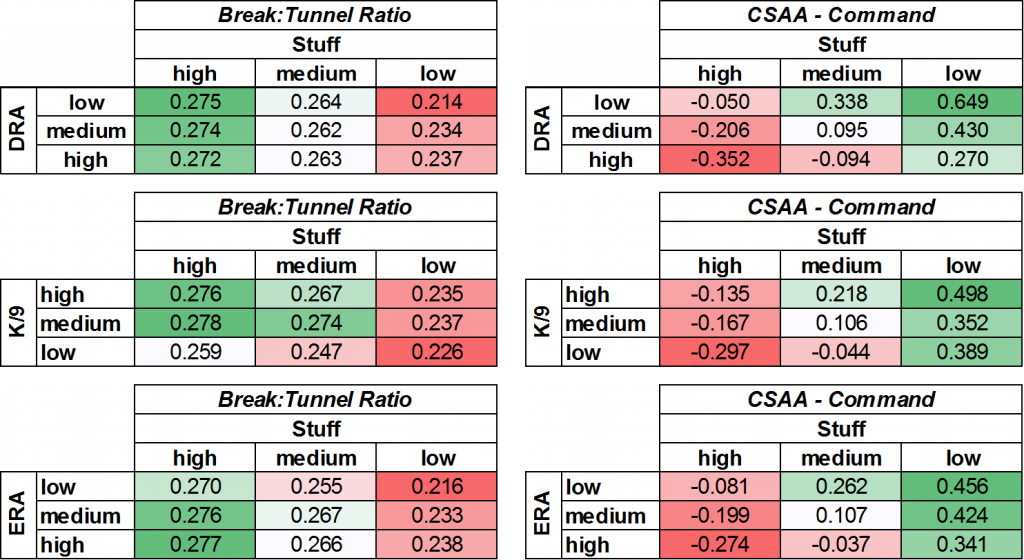
I’ll start with the tunneling story. This one doesn’t necessarily cast a whole lot of light on the situation. The best Stuff, and the best tunneling resulted in the lowest DRAs, and the highest k/9’s. The ERA section was even muddled, with the best stuff, and best tunneling resulting in the highest ERAs. That being said, the difference between the lowest tunneling value and the highest average break:tunnel ratio was only 22%.
The Stuff relationship with command is a lot more interesting. For those pitchers who had the least Stuff, but the best ERA, their average CSAA was 160% better than those who had great stuff, and a high ERA. On the flip side, check out what happens when pitchers have great Stuff. In general, those with great stuff don’t have great command – and those who are successful just keep that filth in the zone and let the hitter worry about making contact. This works out the same for K/9, and DRA – those who had the least amount of Stuff and the best results all had much better command. Once again, I don’t think this necessarily is ground breaking information (particularly for me, a known admirer of Marco Estrada, and all of his glory). However, I think this is a great validation of Baseball Prospectus’ command metric – and it has some great insight into pitchers who may age better than others. As players get older, their stuff drops off linearly. At the exact same time, the command values increase. Theoretically, a pitcher with great command would be able to overcome their lack of Stuff as they age.

Figure 1. Stuff (red) vs Command (CSAA – in Blue) as pitchers age.

Figure 2. Average ERA and DRA as Pitchers Age.
A great example of this is Felix Hernandez. Felix started his career throwing as hard as anyone in baseball, but has had his stuff drop off over the past years. Aside from one season where things looked a bit different, the trends for Stuff and Command look very similar to the population graph – a sign that Felix has adapted what he does as a pitcher to continue to be successful.

Figure 3. Stuff and Command as Felix Hernandez ages
So, now that we have established a loose relationship between all of these metrics, let’s look at a few lists to help better understand the arms behind the numbers.
These are the pitchers who have it all together. Zack Britton had elite Stuff, elite command, and parlayed this into one of the league’s best ERAs of all time. Kenta Maeda had a breakout rookie season, and Justin Verlander reinforced the theory that he has discovered the fountain of youth.
| Name | Stuff | CSAA | Break:Tunnel | DRA |
|---|---|---|---|---|
| Brad Brach | 1.66 | 0.50 | 0.28 | 3.16 |
| Cam Bedrosian | 1.96 | 0.50 | 0.33 | 2.55 |
| Carlos Carrasco | 1.58 | 0.30 | 0.24 | 2.69 |
| Chris Sale | 1.29 | 0.70 | 0.25 | 2.69 |
| Cody Allen | 1.57 | 0.70 | 0.37 | 2.50 |
| Cole Hamels | 0.76 | 1.00 | 0.27 | 2.65 |
| Hector Rondon | 2.27 | 1.20 | 0.21 | 2.71 |
| Jacob deGrom | 1.50 | 0.80 | 0.24 | 3.48 |
| Jim Johnson | 1.30 | 0.60 | 0.36 | 2.90 |
| Jose Fernandez | 1.61 | 1.40 | 0.27 | 2.23 |
| Justin Verlander | 1.94 | 1.40 | 0.30 | 2.75 |
| Kenta Maeda | 1.31 | 1.10 | 0.37 | 3.41 |
| Kyle Barraclough | 1.76 | 0.30 | 0.29 | 2.35 |
| Madison Bumgarner | 0.95 | 1.10 | 0.31 | 3.25 |
| Matt Bush | 3.41 | 0.90 | 0.34 | 3.05 |
| Rick Porcello | 1.22 | 0.80 | 0.31 | 3.45 |
| Roberto Osuna | 2.15 | 0.90 | 0.24 | 3.52 |
| Sammy Solis | 1.13 | 0.50 | 0.28 | 3.87 |
| Sean Doolittle | 1.31 | 0.30 | 0.18 | 3.25 |
| Tanner Roark | 0.86 | 0.40 | 0.27 | 4.45 |
| Tony Barnette | 1.00 | 0.40 | 0.26 | 3.60 |
| Tyler Thornburg | 1.92 | 0.40 | 0.44 | 2.89 |
| Will Smith | 0.96 | 1.00 | 0.40 | 3.58 |
| Zach Britton | 2.17 | 1.00 | 0.11 | 2.17 |
These guys had great Stuff and great ERA, but they didn’t have elite command metrics. In a sense, these guys offered up a “try and hit this” mentality, and usually ended up blowing hitters away. I’m looking at you, Noah Syndergaard and Aaron Sanchez (oh, what a rotation that would have been in Toronto).
| Name | Stuff | CSAA | Break:Tunnel | DRA |
|---|---|---|---|---|
| Aaron Sanchez | 2.32 | -0.70 | 0.31 | 3.77 |
| Andrew Miller | 1.24 | -0.40 | 0.36 | 1.22 |
| Aroldis Chapman | 4.99 | -2.10 | 0.15 | 2.04 |
| Blake Treinen | 1.94 | -2.10 | 0.17 | 3.51 |
| Brad Hand | 0.93 | -1.10 | 0.26 | 2.70 |
| Bryan Shaw | 0.81 | -1.70 | 0.21 | 3.71 |
| Carlos Martinez | 2.39 | -1.10 | 0.22 | 3.73 |
| David Phelps | 1.25 | -0.40 | 0.25 | 2.85 |
| Dellin Betances | 2.41 | -0.50 | 0.35 | 1.57 |
| Dustin McGowan | 1.76 | -1.40 | 0.23 | 3.85 |
| Fernando Rodney | 0.75 | -1.30 | 0.22 | 3.49 |
| Heath Hembree | 1.01 | -0.40 | 0.28 | 4.97 |
| Hector Neris | 1.17 | -1.40 | 0.22 | 3.43 |
| Hunter Strickland | 2.93 | -0.90 | 0.29 | 3.88 |
| Jake Arrieta | 2.03 | -1.40 | 0.27 | 4.02 |
| Jeremy Jeffress | 2.29 | -1.30 | 0.26 | 4.11 |
| Jeurys Familia | 2.91 | -1.60 | 0.19 | 3.60 |
| Joaquin Benoit | 1.36 | -0.80 | 0.18 | 3.82 |
| Joseph Biagini | 2.14 | -0.70 | 0.37 | 3.86 |
| Lance McCullers | 1.31 | -0.40 | 0.32 | 2.80 |
| Mauricio Cabrera | 4.38 | -1.00 | 0.21 | 4.76 |
| Max Scherzer | 1.23 | -1.60 | 0.28 | 3.01 |
| Michael Lorenzen | 2.31 | -0.60 | 0.23 | 3.05 |
| Mike Montgomery | 1.26 | -1.20 | 0.35 | 3.89 |
| Mychal Givens | 1.01 | -1.30 | 0.21 | 3.63 |
| Noah Syndergaard | 3.22 | -1.00 | 0.26 | 2.71 |
| Pedro Baez | 2.74 | -0.70 | 0.18 | 3.65 |
| Raisel Iglesias | 1.27 | -1.20 | 0.22 | 3.47 |
| Rich Hill | 0.94 | -0.40 | 0.43 | 2.56 |
| Robbie Ross Jr. | 0.92 | -0.50 | 0.22 | 3.79 |
| Sam Dyson | 1.35 | -0.90 | 0.18 | 4.05 |
| Seth Lugo | 1.63 | -0.40 | 0.36 | 5.06 |
| Wade Davis | 1.95 | -0.40 | 0.37 | 3.73 |
These are the pitchers that didn’t have great Stuff, but had elite command and used that to have great seasons. It isn’t surprising to see Kyle Hendricks on this list, but to see Masahiro Tanaka here is a bit shocking. His low Stuff in the 2016 season is a far departure to what it was when he broke into the league, but is a testament to his ability to adjust and find new ways to be successful.
| Name | Stuff | CSAA | Break:Tunnel | DRA |
|---|---|---|---|---|
| Alex Claudio | -1.67 | 0.90 | 0.24 | 3.73 |
| Brad Ziegler | -2.81 | 2.90 | 0.15 | 2.99 |
| Dan Otero | -1.21 | 0.30 | 0.17 | 3.06 |
| Fernando Salas | -0.48 | 0.60 | 0.25 | 4.05 |
| Kyle Hendricks | -2.46 | 2.50 | 0.21 | 3.34 |
| Masahiro Tanaka | -0.77 | 1.20 | 0.20 | 3.55 |
| Ryan Dull | -0.69 | 0.70 | 0.25 | 3.71 |
| Tommy Layne | -0.51 | 0.60 | 0.15 | 4.34 |
| Travis Wood | -1.08 | 0.70 | 0.22 | 5.75 |
In this final list, you see pitchers that put everything together: Stuff, and Command, but didn’t parlay it into great results on the field. For Tigers fans, seeing Jordan Zimmerman on this list is encouraging – perhaps that wasn’t an albatros contract, and he will be back to his previous form in 2017. Sonny Gray battled injury, but if his health returns, he could be back to his old dominant self. Michael “420 Blazek” – shout out to the guys at Brew Crew Baseball who were the first non-Jays fans to ever read something that I wrote – had great stuff and command, but didn’t get great results. Next season, he could be a key piece in the Brewers bullpen.
| Name | Stuff | CSAA | Break:Tunnel | DRA |
|---|---|---|---|---|
| Adam Warren | 1.10 | 0.40 | 0.31 | 5.09 |
| Andrew Cashner | 1.21 | 0.70 | 0.24 | 4.55 |
| Chad Bettis | 0.76 | 1.10 | 0.28 | 4.23 |
| Daniel Hudson | 1.73 | 0.50 | 0.19 | 4.20 |
| Drew Storen | 1.02 | 1.00 | 0.30 | 4.05 |
| John Gant | 1.26 | 1.50 | 0.40 | 3.93 |
| Jordan Zimmermann | 0.75 | 0.40 | 0.27 | 4.94 |
| Juan Nicasio | 0.91 | 0.80 | 0.18 | 3.34 |
| Kevin Jepsen | 1.23 | 1.00 | 0.33 | 6.79 |
| Keyvius Sampson | 1.54 | 1.70 | 0.32 | 4.94 |
| Michael Blazek | 1.90 | 0.60 | 0.30 | 4.94 |
| Sonny Gray | 1.18 | 1.40 | 0.31 | 3.92 |
| Taijuan Walker | 1.58 | 0.60 | 0.31 | 3.84 |
| Trevor May | 1.75 | 0.30 | 0.41 | 3.14 |
| Wily Peralta | 1.35 | 2.00 | 0.17 | 4.47 |
| Zack Greinke | 1.31 | 2.10 | 0.40 | 3.51 |
So, in summary – combining the Stuff Metric with BP’s Command and Tunnels provides some insight into how pitchers get hitters out. These new metrics can be used to help look at how pitchers age and change their strategies to forge long careers.
References
Long, J., Judge, J., & Pavlidis, H., (2017a). Prospectus Feature: Introducing Pitch Tunnels. Retrieved from: http://www.baseballprospectus.com/article.php?articleid=31030, published January 24, 2017.
Long, J., Judge, J., & Pavlidis, H., (2017b). Prospectus Feature: Introducing Pitch Tunnels. Retrieved from: http://www.baseballprospectus.com/article.php?articleid=31022, published January 23, 2017.
Leave a Reply
You must be logged in to post a comment.