Whenever I write something that trumpets the importance of velocity for pitchers, someone jumps in and says “velocity isn’t everything. Gregg Maddux exists”. You’re damn right he exists. You know who else exists? Vesna Vulović. She’s the Serbian flight attendant that fell 33,000 feet from an exploding airplane and lived. Yes, she lived, but I don’t see many people lining up to see if they can replicate her landing strategy.
The moral of the story is, if you throw 89 mph – the chances are – you are a bigger freak than the pitcher that throws 97 mph. Throwing with pin point control is a much more difficult task than throwing hard – for example, the AL Cy Young winner in 2015 missed his spot by 12″ on average according to CommandFX data (and Astros MiLB pitching coach, Drew French)
@drivelinebases The AL cy young winner in 2015 missed his intended location on average by 12 inches
— Drew French (@Drew_French) May 28, 2016
How do you teach command? Look at the moments immediate before ball release in this paper by Matso et al., (2017). I’m am highly interested in the training techniques that can be developed to increase precision in this type of movement – but we do know, if you make your pitchers strong, there’s a relationship with them throwing harder.
So, let’s look at the relationships between velocity, command, and control, with outcome metrics, for the final time.
I have been mildly obsessed with the command and control metrics produced by baseball prospectus, because they tell a far more representative story about what a pitcher is trying to do than walk rates. You can have exceptional command and control, but if a hitter lays off that full count slider that you located perfectly outside the zone, that’s still a walk. The called strikes above average metric gives us an idea of a pitcher’s command – when they throw a pitch on the black, how do they compare to the rest of the MLB in getting it called a strike. The strike probability statistic gives us an idea of the likelihood of a pitch being in the zone. This is indicative of the control a pitcher has – can he throw his fastball for a strike – regardless of how pin point accurate that pitch is – when he needs to. I’m going to use these as the metrics for command and control in this article.
So, on an island, how does pitch velocity, command, and control relate to a pitcher’s performance? I’ve gone with a gigantic sample for this study – anyone who has thrown 50 innings since the 2008 season. Each pitcher-season represents one entry – so there could theoretically be multiple entries for one pitcher. This resulted in a sample of 2782 data points. Here are the correlation coefficients for all of those metrics. A negative value means that with an increase in one metric, there is a decrease in the other (for example, a -0.36 between velocity and xFIP means that as velocity increases, xFIP decreases). The r2 value represents how much variability in one metric can be accounted for with the variability of another metric.
| Correlation Coefficient (r) | |||||||
| xFIP | DRA | ERA | BB/9 | K/9 | GB% | SwStr% | |
| FB Velocity | -0.36 | -0.34 | -0.24 | 0.14 | 0.47 | 0.09 | 0.42 |
| Command | -0.06 | -0.11 | -0.07 | -0.23 | -0.04 | -0.11 | -0.07 |
| Control | -0.14 | -0.05 | -0.05 | -0.44 | -0.01 | -0.15 | -0.12 |
| r2 | |||||||
| xFIP | DRA | ERA | BB/9 | K/9 | GB% | SwStr% | |
| FB Velocity | 13% | 12% | 6% | 2% | 22% | 1% | 18% |
| Command | 0% | 1% | 0% | 5% | 0% | 1% | 1% |
| Control | 2% | 0% | 0% | 19% | 0% | 2% | 1% |
So, our take home point here, is that while no individual metric accounts for a huge amount of variance in output metrics, fastball velocity is by far the best predictor of success when compared to command or control.
But, there are pitchers who survive without having great fastball velocity. Remember? Greg Maddux? HOW CAN YOU FORGET.
So, let’s compare the top 25%ile velocity pitchers against the bottom 25%ile pitchers. Clearly, those who operate in the lowest quartile of fastball velocity (less than 90 mph) are just as successful as those who throw extremely hard (over 93.4 mph). Just ask Twitter.
| Velocity | xFIP | DRA | ERA | BB/9 | |
| High Velocity (n = 722) | 94.75 ± 1.14 | 3.61 ± 0.69 | 3.61 ± 1.06 | 3.43 ± 1.1 | 3.29 ± 1.04 |
| Low Velocity (n = 702) | 88.38 ± 1.47 | 4.24 ± 0.6 | 4.71 ± 1.22 | 4.17 ± 1.13 | 2.93 ± 0.95 |
| K/9 | GB% | Swinging Strike % | Command | Control | |
| High Velocity (n = 722) | 8.96 ± 2.09 | 0.46 ± 0.08 | 0.11 ± 0.02 | -0.25 ± 0.7 | 0.47 ± 0.03 |
| Low Velocity (n = 702) | 6.51 ± 1.55 | 0.44 ± 0.09 | 0.08 ± 0.02 | 0.51 ± 0.86 | 0.46 ± 0.03 |
The metrics that jump out to the first, are the fact that high velocity pitchers have more than a half run of ERA and xFIP advantage over the low velocity pitchers, and OVER a 1 RUN DIFFERENCE IN DRA. More than 1 full run! There is an advantage for the low velocity pitchers in walking fewer batters – by 0.3 walks per game. Compare this to the strike out rates, where high velocity pitchers strike out over 2 more batters per 9 innings than the low velocity pitchers. This means that the low velocity pitchers gain their effectiveness through bad contact, right? That is also not true – there was no statistical difference between the high velocity and low velocity groups for ground ball rates. Also, the low velocity group had better command – they got more called strikes on the edge of the strike zone compared to the high velocity group, but they didn’t have a better chance of throwing a ball in the strike zone.
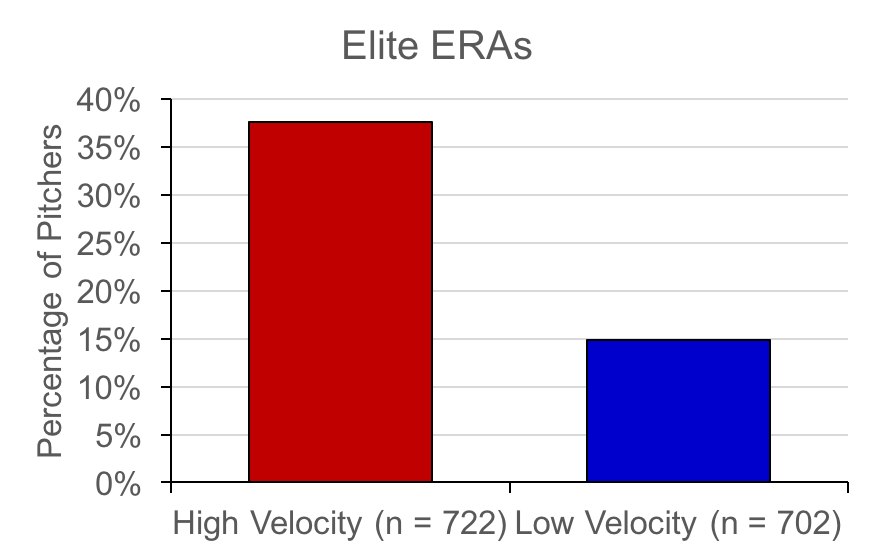
Finally, I just looked at the proportion of pitchers in the high and low velocity group that had “elite” ERAs (in the top quartile) during a season. This value represented an ERA of less than 3.00 in a season. There were 38% of pitchers in the high velocity group (271 of 722 pitchers) that had elite ERAs. The low velocity group? Only 15% of pitchers (104 of 702 pitchers).
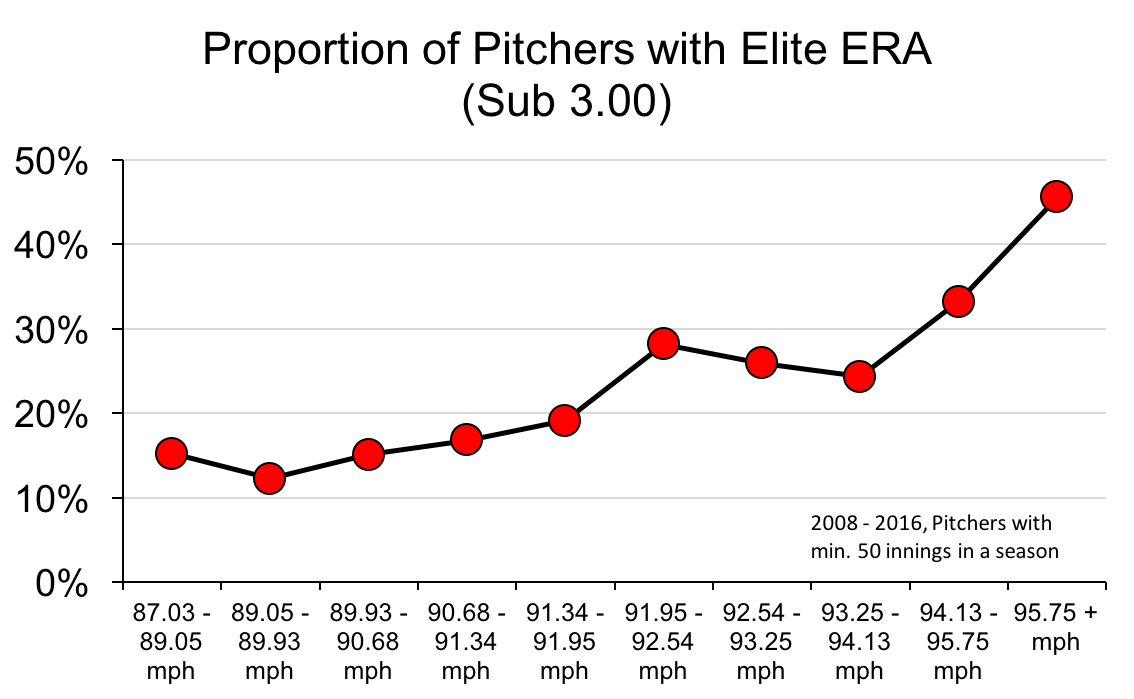
Even further – look at the proportion of pitchers who have elite ERAs in each percentile of pitchers, ranging from 87 mph to 95+ mph fastball velocities.
It’s tough to argue that velocity doesn’t rule.
I know this blog has become a bit redundant with this topic recently, but I want to highlight why I feel this is an important topic. There is extensive debate about how to develop effective pitchers. Broadly, this comes down to two camps in pitching twitter – those who try to say that velocity isn’t everything, and you should teach kids to throw with better command, and one that says throw as hard as you possibly can. This debate is over. Velocity wins. There is countless evidence to suggest that giving a batter less reaction time, limits their ability to effectively execute a movement pattern and hit the ball.
The challenge is no longer whether or not it is important to develop pitchers who throw hard. Those who make it to the major league level without a plus fastball are the exception to the rule, and not the alternative to throwing hard. If you want to make a difference – figure out how to help pitchers get stronger and keep their strength throughout a season (Toby et al., 2015), reduce their fatigue, and keep them healthy.
References
Matsuo, T., Jinji, T., Hirayama, D., Nasu, D., Ozaki, H., & Kumagawa, D. (2017). Middle finger and ball movements around ball release during baseball fastball pitching. Sports Biomechanics, 1-12.
Toby, B., Glidewell, E., Morris, B., Key, V. H., Nelson, J. D., Schroeppel, J. P., … & McIff, T. (2015). Strength of Dynamic Stabilizers of the Elbow in Professional Baseball Pitchers Decreases during Baseball Season. Orthopaedic Journal of Sports Medicine, 3(2 suppl), 2325967115S00163.

Recent Comments