The hits just keep on coming from the Motus Sleeve and Driveline! Last week, the brains at driveline posted their data from 70 pitchers throwing 5 pitch, fastball bullpen sessions, and the Motus and velocity data to go along with them.
For those of you who don’t know what the Motus Baseball Sleeve is, it is a device that fits neatly into a compression sleeve, which can be worn by baseball pitchers to get the predicted ulnar collateral ligament (UCL) stress that occurs during throwing. It also provides pitchers and coaches with data on the arm slot (with respect to horizontal), the arm speed (in RPM), and the maximum predicted external rotation of the shoulder.
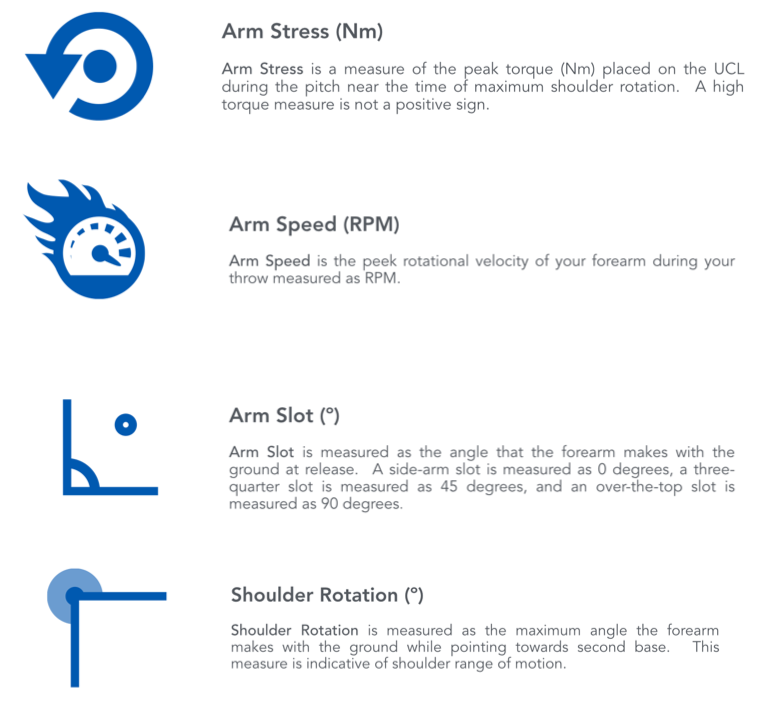
Figure 1. A description of the key metrics from the Motus Throw app – found at http://msupport.motusglobal.com/hc/en-us/articles/207295137-Key-Metrics.
I have explored the relationship between pitch velocity and elbow stress on this site before, and the driveline team has done the same thing for both fastballs, and breaking pitches. Currently, pitch velocity appears to explain about 17% of the variance in elbow stress. That means – before you look at anything else – pitcher height, mechanics, fastball type – you have 17% of your elbow stress already accounted for. While this doesn’t seem like much, you can see there is a positive, significant relationship between velocity and elbow stress.
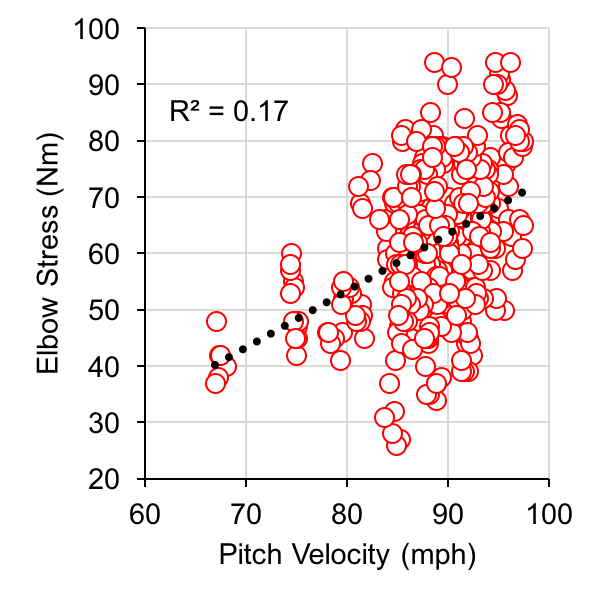
Figure 2. Velocity vs. Elbow Stress. You know this one already, though!
So, if 17 % of the elbow stress is accounted for by the pitch velocity, where are the other 83%? And, if two people throw at the same speed, but one has higher elbow stress than the other – what’s going on there?
I broke the driveline data down by velocity percentiles – just to help normalize things. I then broke this down into 5 % ile windows. At each 5%ile window for velocity, I looked at what the average predicted UCL stress was. I then determined if the pitch had greater than, or less than average stress at a given velocity range. Finally, I examined the average arm slot, arm speed, and shoulder rotation for those who had less than average, or more than average elbow stress, at a given velocity.
Results
When examining the data by pitch, there were 420 samples (nice). Comparing the higher than average stress, and the lower than average stress groups at standardized pitch velocities, there were some interesting findings. To determine statistical significance between the low and high stress groups, a t-test was used with significance set to p < 0.05. Cohen’s d was calculated for significant effects.

Figure 3. Average Arm Speed, Arm Slot, and Shoulder rotation for pitches that were over average stress levels at a set velocity level.
Higher stress pitches at a given velocity had significantly lower arm speeds (figure 3A), and significantly higher arm slots (p < 0.05, d = 0.26, and 0.21, respectively). There was no statistically significant difference between maximum shoulder rotation angles in either group (p < 0.05). This is particularly interesting, as Whiteside and colleagues (2016), found there was a significantly higher risk of UCL reconstruction surgery in pitchers with less pronounced horizontal release points. These data seem to support their findings.
The next step is to include anthropometric measures of height and weight into these calculations, and see how those improve the prediction of elbow stress alongside the key motus metrics.
References
O’Connell, M., and Boddy, K. (2017). Bullpens, Tracking Elbow Torque, and mStress. Retrieved from https://www.drivelinebaseball.com/2017/03/bullpens-tracking-elbow-torque-and-mstress/, March 4, 2017.
Whiteside, D., Martini, D. N., Lepley, A. S., Zernicke, R. F., & Goulet, G. C. (2016). Predictors of ulnar collateral ligament reconstruction in Major League Baseball pitchers. The American journal of sports medicine, 44(9), 2202-2209.
Leave a Reply
You must be logged in to post a comment.