I’ve done a bunch of work modelling fatigue in pitchers, including the study used to suggest Pitch Clocks would lead to increased fatigue 1 , how pitches per inning influences fatigue levels 2 , and a new workload metric based on fatigue 3 . For a lot of these simulations, I used average pitch counts and paces from FanGraphs. This provides an overall picture of the estimated fatigue in a pitcher, but doesn’t really account for the individual variability associated with a game. I was originally trying to get a bigger picture idea of how fatigue accumulated during pitching – so this was appropriate. However, I missed out on some pretty cool looking graphs – which depending on who you talk to, is the entire point of science.
Last week, I tweeted out a few graphs that looked at predicted forearm fatigue in pitchers from games during the 2014, and 2015 season. Here was the first one:
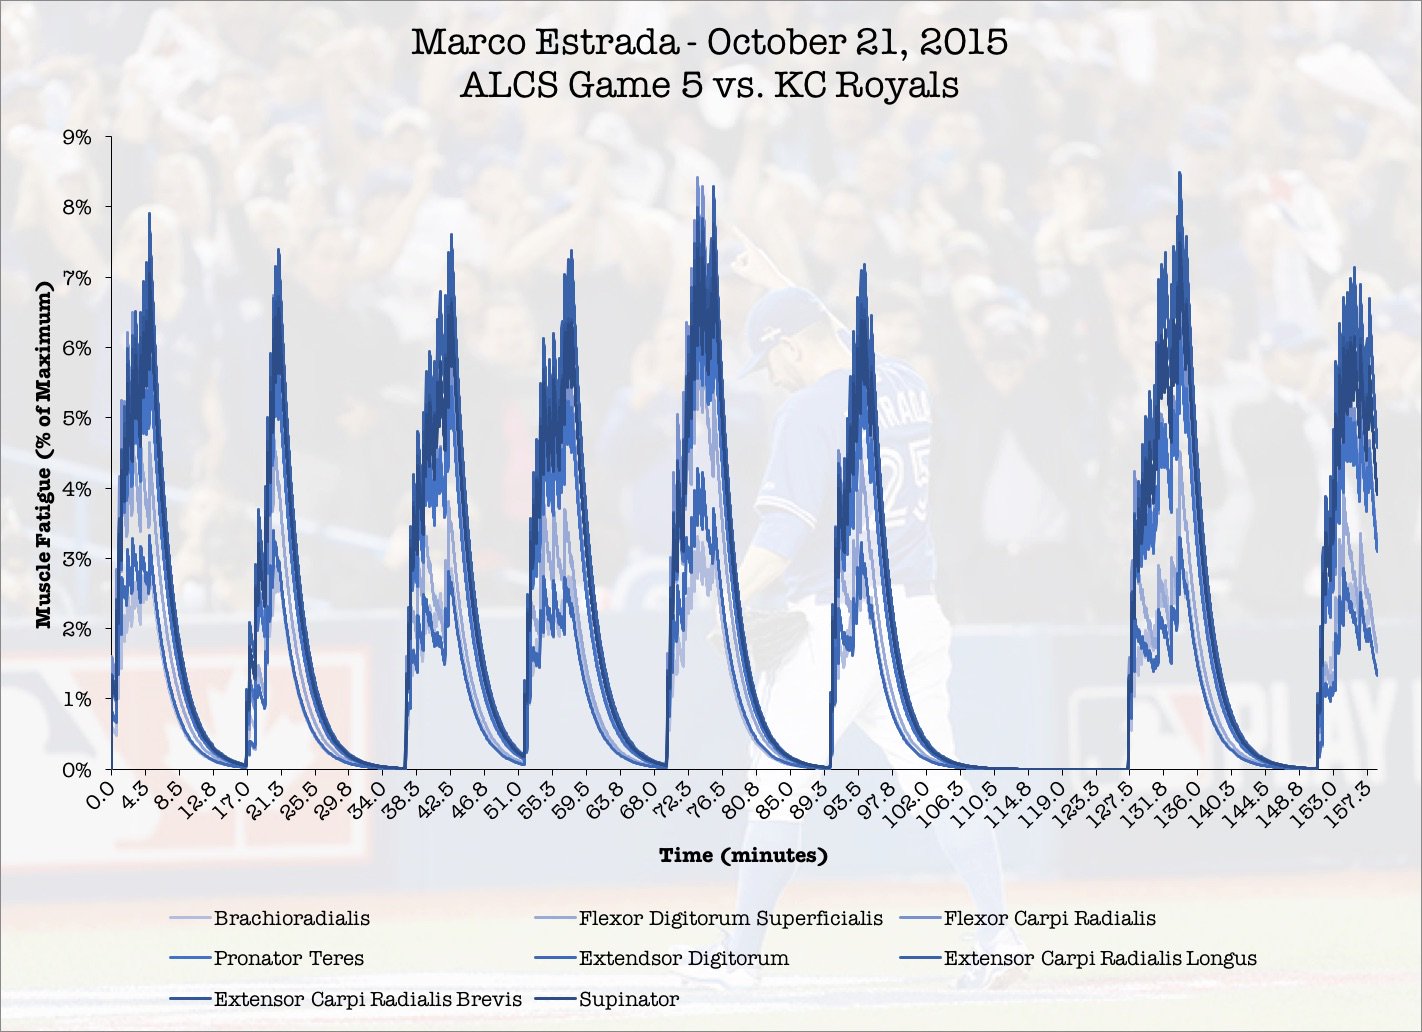
Playing around with data visualization – Marco Estrada’s predicted forearm muscle fatigue during his game 5 gem from the 2015 ALCS. pic.twitter.com/fWqH0JaqWm
— Mike Sonne (@DrMikeSonne) December 2, 2016
In game 5 of the ALCS in 2015, Marco Estrada went 7 and 2/3 innings, staving off elimination and sending the series back to Kansas City. Estrada started out fast, and never gave up a run until the 7th inning. It was a sign of things to come – absolute clutch pitching performances that buoyed the Blue Jays pitching staff in the 2016 season. Here’s how I was able to get these simulations.
Methods
The first step in this method was to get the pitch types, sequence, and time of each pitch during an outing. From the MLB’s gameday data, I was able to pull this sequence out by querying the database by pitcher and game. Here’s the MySQL Query I used for that purpose:
select pitches.sv_id, atbats.inning, atbats.outs, pitches.pitch_type, atbats.des, atbats.pitcher from atbats, pitches, games where pitches.ab_id = atbats.ab_id and atbats.game_id = games.game_id and games.game_id = ‘23910’ and atbats.pitcher = 462136 order by atbats.inning, atbats.outs ASC
This produced a result that looked like this:
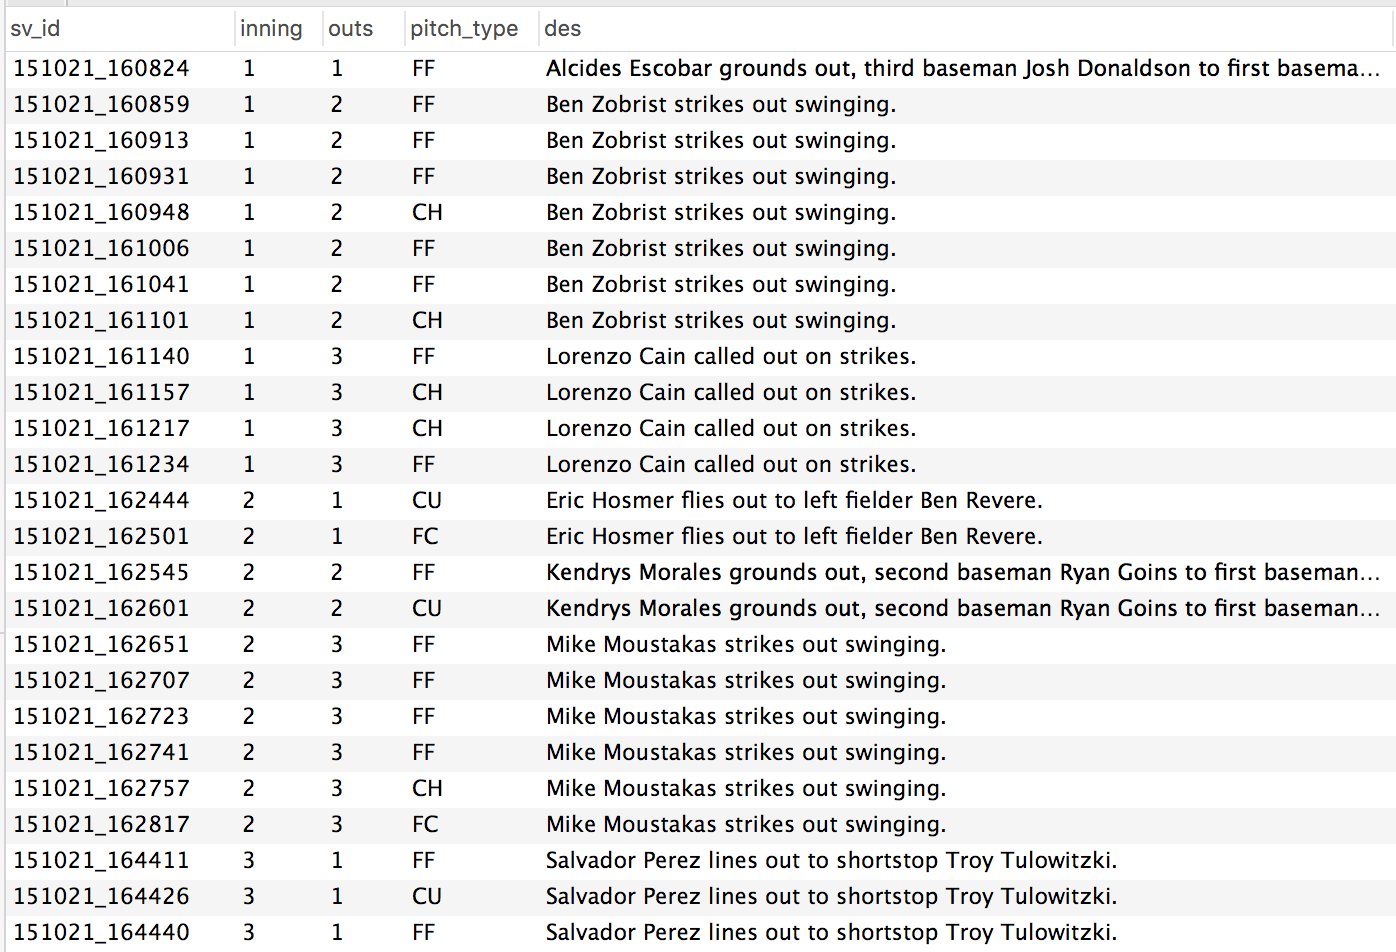
Figure 1. Sample output from the MySQL query posted in the snippet above.
Every pitch, organized by inning and sequence, for an individual pitcher in an individual game. That value on the left – the sv_id from the gameday atbats table, contained the date (YYMMDD_HHMMSS). Everything I needed to calculate the amount of time between each pitch.
From the paper on pitch clocks and fatigue, I had created a time history of muscle demands for a series of forearm muscles. These were defined as either fastball type pitches, or breaking type pitches. In the graphs, figure A are the demands for fastballs, and figure B are the demands of curve balls / breaking pitches. These time histories are from a series of studies, summarized in the pitch clock papers.

So, back to the Gameday database. I exported the demands from the query into Matlab. I coded each pitch as being either a fastball or a breaking ball, then attached the appropriate amount of rest after each pitch. Here’s an example from Marco Estrada’s ALCS game:

Figure 3. Pitch selection and rest time from Estrada’s game 5 of the 2015 ALCS. All pitches coded as a 1 were fastballs. All pitches coded as 2 were breaking pitches. These were used to simulate the time histories of demands for Estrada, and then determine the predicted fatigue level.

Figure 4. Muscle demands by pitch during a 12 pitch first inning. The first pitch of the game lead to a ground ball out. The next 7 pitches resulted in a strike out, followed by a 4 pitch strike out. You can see the larger gaps between pitches as being reflective the time between batters.
The largest numbers in this time history represented the time between innings. What I have learned from this is, is just how fatiguing it can be for a pitcher to have a long inning, followed by a short half inning where his team goes three up three down.
At this point, I had everything I needed to predict fatigue in a pitcher. Using the EMG demands from figure 4, the three compartment fatigue model was able to generate an example of how much muscle force would be lost at a given time based on the previous history of muscle demands. For Estrada, his peak fatigue came during the 5th and 7th innings of the game. During these innings, he threw 14 and 17 pitches – the highest per inning in the game. In the 5th inning, he threw more fastballs than breaking pitches, which resulted in higher fatigue levels.
Interestingly. innings where pitchers throw more fastballs have higher fatigue levels. Greater homogeneity in pitch selection has been identified as a risk factor for UCL reconstruction by Whiteside and colleagues (2016) 4 have higher fatigue levels occur when pitchers throw more fastballs.
Conclusions
This methodology could now allow for examination of fatigue during starts where a pitcher was hurt, or from a series of starts where a pitcher became hurt. If at the start of the season, a pitcher had his EMG activation levels recorded during a bullpen session, these accurate demands could be substituted into the model for a more accurate fatigue prediction. For now – this is a fun new way to look at a pitching performance.
If you have any requests for simulations, let me know!
0 Comments
1 Pingback