Science and Baseball

Month: September 2016

The Blue Jays best Stuff

I write a lot about Stuff on this site, with the goal of quantifying Stuff for the entire MLB. However, I am unabashedly, a Toronto Blue Jays fan first – and a Detroit Tigers fan (a distant) second. Part of the fun of using the PitchF/x data on the fangraphs site, is that I can look back in time, and figure out how different pitchers compare against each other. Also, if we’re looking to find out who had the best stuff in Blue Jays history – we can draw some inferences here. Fastball velocity has increased throughout league history, so it is reasonable to say that in the past 10 years, we have likely seen the best stuff in MLB pitcher history.

Let’s look at the Jays all time stuff leaderboard.

Overall Best Stuff

I’ve been writing stuff reports on the Jays pitchers over at Baseball Prospectus this season, so the top of this list shouldn’t be too shocking.  Aaron Sanchez may have the best Stuff in the history of the Blue Jays. My favourite arm in the top 10 has to be Brandon League – I loved watching him pitch for the Jays, despite his short comings (giving up bombs at inopportune times). I was a bit surprised to see Ricky Romero up as high he was – as I always viewed him as a command type pitcher. In reality, his pitch separation was elite, and he had decent change in speed. It’s a shame his knees gave up on him.

Best Stuff Seasons

Once again, Aaron Sanchez tops the list – but Joe Biagini comes in second, with his rookie season being the second best stuff season we`ve seen in the past 10 years for the Blue Jays. The biggest surprise I`m seeing is down near the bottom of the list. BJ Ryan sits in the negative with his stuff – and all I remember is him coming out of the bullpen and annihilating hitters with his fastball. Maybe it was the fact they put up flames on the video boards, more so than he was throwing flames?? I’ve been tricked again!

Back to the FUture – Workloads since 2007

Well, now that we know what Brandon Morrow’s stuff looked like with the Jays in 2010, let’s move on to understanding pitcher workloads since 2007.

First – a foray back into my thought process for the days of rest penalty in the metric. If you look back to the second article on Cumulative FU’s, I proposed that for consecutive day appearances, the FU’s be multiplied by 5. For 2 to 4 days of rest, the FU’s were multiplied by 2. For the standard, every 5th day – there was no multiplier for the FUs.

When I looked at the predicted FU’s for all pitchers (and as you’ll see shortly), the high use relievers – 80-100 innings in a season – had the highest workloads – significantly higher workloads than starters for the most part. I thought, I may have to make an adjustment to the metric – but I wanted to look at starter vs. reliever injury rates first.

I downloaded Jon Roegele’s Tommy John Surgery (TJS) list (@MLBPlayerAnalys), and then classified pitchers as relievers (if 80% of more of their innings came from relief innings), or starters. I compared numbers from the 2007 to 2016 seasons. Only pitchers who pitched 10 innings in a season were included in the analysis.

I looked at the sum of innings pitched and the number of TJS that occurred for all pitchers, and came up with a ratio of innings per TJS, for both starters, and relievers.

There were a total of 125092 innings pitched by Relievers during this time period, and 290401.1 innings pitched by starters. During that time, 151 relief pitchers required TJS, and 141 starters required surgery. This worked out to a ratio of 848.4 innings per TJS for Relievers, and 2059.6 innings per TJS. These data should likely be vetted a bit more carefully before they’re viewed as gospel – but this is a scary number. Aren’t reducing innings and pitches during the season supposed to protect relief pitchers’ arms?

I have argued that pitchers often throw harder when they move to the bullpen, and that this extra velocity places more stress on the UCL. In that same time period (2007, to 2016), relief pitchers threw their average fastball at a velocity of 91.5 +/- 3.35 mph, and starters threw their fastball at an average speed of 90.7 +/- 2.6 mph. Maybe, just maybe – those back to back to back appearances that relievers can make are worse for their bodies than the 6 innings pitched every 5 days?

Anyway – let’s move on to the workload metrics since 2007!

Starters

Team Workloads

The 2011 Rays take the cake for total workload for starting pitchers. Lead by David Price and Big Game James Shields, the Rays starters were not only good – they worked hard in the 2011 season. Overall, the highest average workload belonged to the tigers – particularly in 2014 and 2015 seasons.

Individual Workloads

The highest workload for a starting pitcher belongs to Justin Verlander in 2011. In fact, it is alarming to see just how many times Verlander and Sabathia’s names show up in the top 25 of this list. Those guys were horses in their prime – and it’s unknown how those huge workloads contributed to both of their recent injury problems. Conversely – how much of their durability during that time was because they worked so much, and had great pitching fitness?

Relief Pitchers

Bullpen Averages

The Rockies 2012 bullpen put in the most about of work during the past ten years. This was a direct result of a really bad starting rotation – only one pitcher cleared 100 innings pitched. The relief core was totally hung out to dry on this team. Overall, the Nationals had the highest yearly workload average for their bullpen (though this is driven by the late 2000’s when they were not very good).  There is a general trend for bullpen workloads to increase in the past 10 years – with 2015 having the highest workload for relievers in that time frame.

Individual Workloads

At first glance, I have to say – these numbers looked just… wrong. Then, I looked again – and they didn’t change.
krod-2010

Francisco Rodriguez put up an INSANE workload in 2010 – 62.84 – with nearly 1800 pitches, and over 100 innings. That’s a lot of exposure to high pressure situations, back to back days, and pitches per inning. The set up men, and the swing men – those who pitch more than an inning in relief, appear to have the highest workload levels. Something else that came up this weekend – was the topic of Dellin Bettances. After giving up a walk off in his third day of work in three days, people talked about his over use with the Yankees. In the past 3 years – no one has a higher workload than Bettances.


You are welcome to question the FU’s! Hit me up at michaelsonne@gmail.com, or on Twitter @DrMikeSonne if you want to debate these findings!

Ye Old Historic Stuff Report – 10 year anniversary

marquee

Every now and then, technological discoveries result in major breakthroughs in science. Certain things that come to mind are: the invention of the microscope and the discovery of insulin. While not in the same breath, the ability for me to split fangraphs queries by team, and by year, may go down as the biggest breakthrough that I have made.

You were probably sitting around, kicking your TV and swearing at your friends while watching the Jays game today – so don’t you want to think about the happier times? Like 2006?


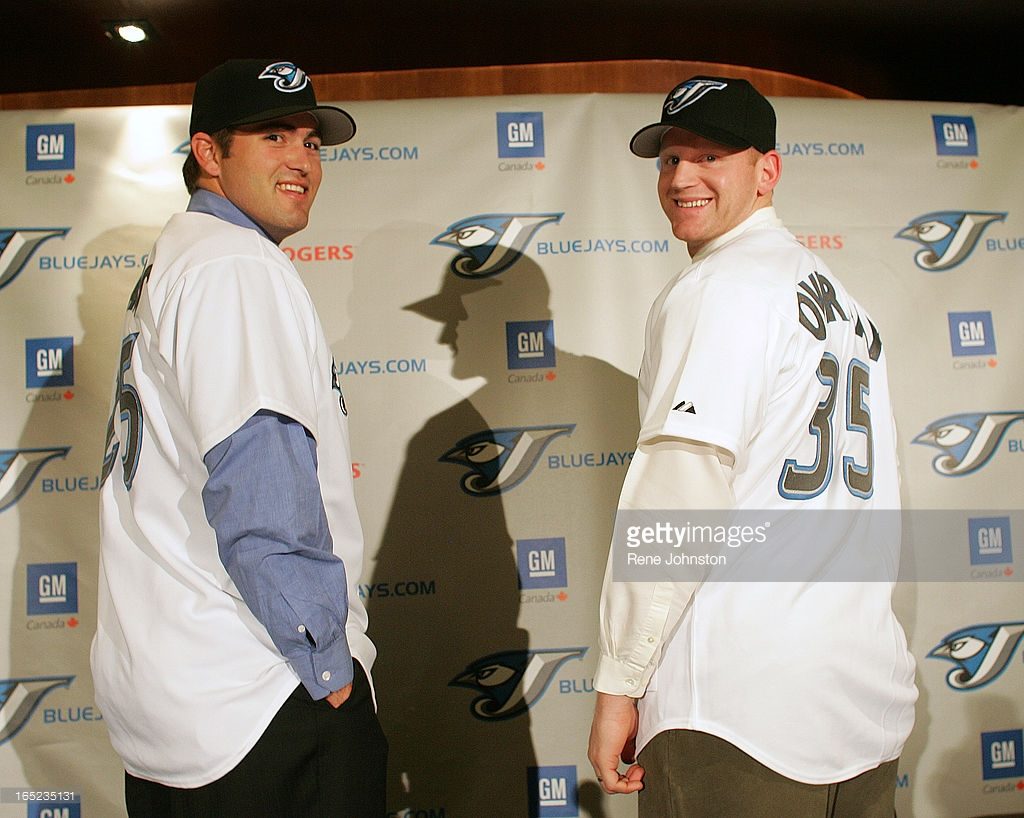
TROY GLAUS and LYLE OVERBAY.12.27.2005. Slugger Troy Glaus and Lyle Overbay are all smiles at the introduction press meet at the Rogers Center Founders Club on Tuesday.(Rene Johnston/ Toronto Star Photo)

TROY GLAUS and LYLE OVERBAY.12.27.2005. Slugger Troy Glaus and Lyle Overbay are all smiles at the introduction press meet at the Rogers Center Founders Club on Tuesday.(Rene Johnston/ Toronto Star Photo)

Oh god, not that…

Let’s take a look at what pitchers, and what pitching staffs have had the best stuff since 2007. Also, let’s look into what starting rotations and bullpens had the highest workloads in the last ten years.

Qualifiers

Ok, to truly qualify for these calculations, pitchers were required to appear in at least 5 games during the MLB season. To be considered a “true starter”, 80% of the innings a pitcher threw had to be in the starting rotation, and they could not have more than 9 relief innings in a season. To be considered a “true reliever”, 80% of the total innings had to be as a reliever, and the pitcher could not have more than 3 starts on the season. Are these rules unfair? LIFE IS UNFAIR.

Stuff

Starters

The best stuff of any starting staff belongs to the 2011 Royals. A fearsome staff that managed to have only one pitcher with better than a 0.500 record, this staff was built on radar guns, and probably not on pitching ability. Luke Hochevar had the best stuff on this staff – and would eventually find a home in the bullpen.

In the time period studied (2007 – 2016),  the best average Stuff belonged to the Royals (an average stuff value of 0.84), followed by the Brewers, then the Cardinals.

The best individual stuff performance belongs to mine and Eno Sarris’s adopted son, Chris Bassitt. In 2016, Bassitt was putting up historic numbers before he sustained an elbow injury and had to have Tommy John Surgery. After that – it becomes the Jake Arrieta show. Before he put things together in 2015, Arrieta has exceptional stuff in 2014, as well as 2013. Sneaking into the top of that list is 2007 Rookie Ubaldo Jiminez.

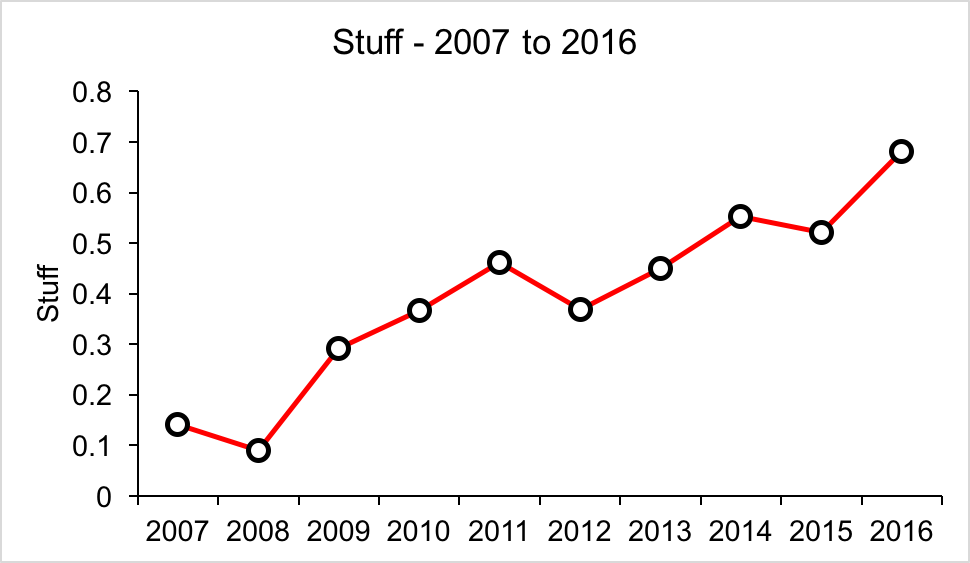
Something really interesting to note – it has been well documented that fastball velocity keeps getting higher every year – and Tommy John Surgeries are also increasing. If you look at Stuff over these 10 years, the Stuff in 2016 is the highest it has ever been. There’s been a relatively linear increase in Stuff over the years, as you can see in this graph.

historic-stuff

Relievers

The Mariners 2013 bullpen had the best stuff in the past 10 years, lead by monster of Stuff, Tom Wilhelmsen (2.03). During the last decade, the best bullpen belonged to Tigers, followed by the Mariners and White Sox. Similar to the Stuff report for Starters, Stuff has increased over that time period for reliever as well (0.29 in 2007, and 0.52 in 2016).

We’ve seen some historic Stuff this season by resident piece of trash Arolids Chapman. In second and third place, a player near and dear to my heart – Joel Zumaya. I for one, fancied myself an experienced Guitar Hero player – so I can relate to the plight of Zumaya who hurt himself playing the iconic video game.

If you need access to these data because you’re curious about more – let me know! I’d be happy to share it with anyone. If you think the metric is wrong – well, go jump off a bridge and make your own Stuff metric.

Emergency Night before Pitch Talks Stuff Report

stuff-report

It has come to my attention that, while updating the Blue Jays Stuff report over at BP Toronto, I have neglected the MLB stuff report on this site. No time like the night before Pitch Talks to fill everyone in on who has the best stuff in the MLB!

Starting Pitchers

The man remains entrenched at the top of his loft perch – Jake Arrieta has the best stuff of all starting pitchers in Major League Baseball.  In fact, the top three are quite significantly higher than anyone else – Arrieta, Syndergaard, and Strasburg are the only starters who have flirted with the mythical 2.0 mark on the Stuff report all season long. For Jays fans, I would like to present how Syndergaard sits near the top of this list, and down at #108… well, you can guess who.

The top starting staffs all reside in Chicago, with the Cubs at #1, and the White Sox at #2. This goes to show – stuff isn’t everything. The cubs are closing in on a 100 win season and the White Sox… well, they’re fighting to steer clear of the Twins at the bottom of the central.

Relief Pitchers

Chapman still sits at number 1, but Mauricio Cabrera seems hellbent on taking the reliever Stuff crown. Both of these arms have an average fastball velocity of over 100mph. That’s their AVERAGE fastball. To make it worse? They can both drop it down into the 80’s when they need to.

As for Bullpens, the Red Sox – buoyed by the electric arm of Craig Kimbrel – have risen to the top of the Stuff rankings. The Cubs are close behind, and the Jays lurk in fourth.


Are you coming to Pitch Talks? Do you have your tickets? If you order your tickets online, use the promo code “stuff” to get $5 off your ticket. See you there!

Giving a big FU to workload metrics in pitchers: Part 2b – Cumulative FUs from FanGraphs

To calculate individual game FU’s, you’ll have to download the pitchFx database. However, if you want to get an idea of how much fatigue a pitcher has accumulated during a season, there is an easier way.

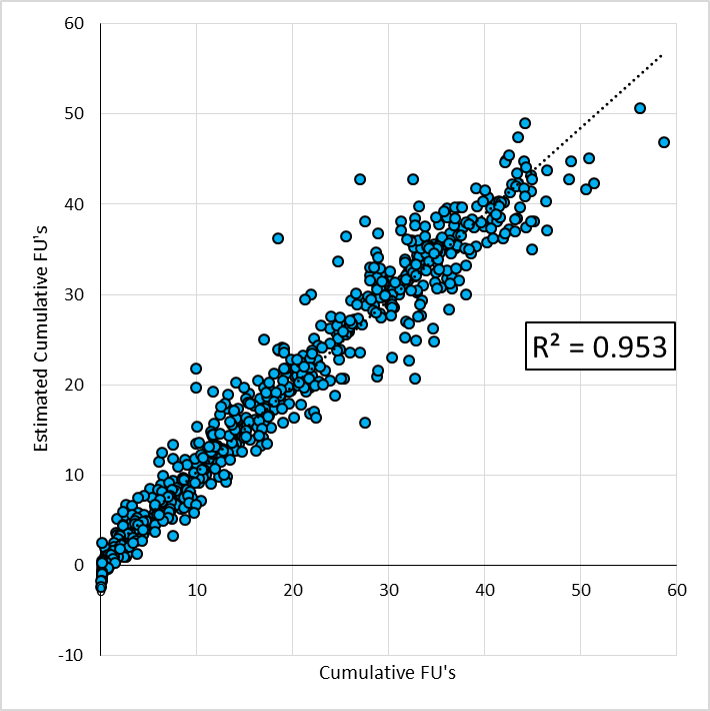
I investigated how well Cumulative FU’s lined up with data I downloaded from FanGraphs from the 2015 season – particularly, the amount of Innings pitched, the pace of pitching, number of relief innings pitched, and total pitches thrown. Using a linear regression approach, I then figured out what the right coefficients would be to predict the cumulative FU’s. Here are the results:

table for regression

regression for cumulative FU's

Overall, the R2 value was 0.95, and the RMS error was 3.0 Cumulative FU’s. Not too bad. Looking a bit more specifically, relief innings pitched was the most significant individual predictor, at R2 = 0.43. The combined variables produce the most accurate replication of the Cumulative FU metric.

If you want to use this to estimate workload in pitchers, the formula is: Cumulative FU’s =-3.38 + 0.10 * IP + 0.43 * Relief IP + 0.12 * Pace + 0.004 * Pitches.

With all of this in mind – now, let’s take a look at some 2016 data.

I went on the FanGraphs site, and generated a custom report with IP, Pitches, Relief IP, and Pace included.

Once again, the list ends up being fairly reliever heavy. Erasmo Ramirez has the highest workload so far this season, with at total of 44.38 FU’s. The first starter that appears on the list is Christopher Devenski at number 2 – but he has started 25 out of his 93.1 innings have come as a starter. The first dedicated starter on this list is Trevor Bauer, all the way down at 62. Once again, he has pitched out of the bullpen at times this season. With only starting innings showing up, Justin Verlander is at 72, accumulating 32.3 FU’s on the season.

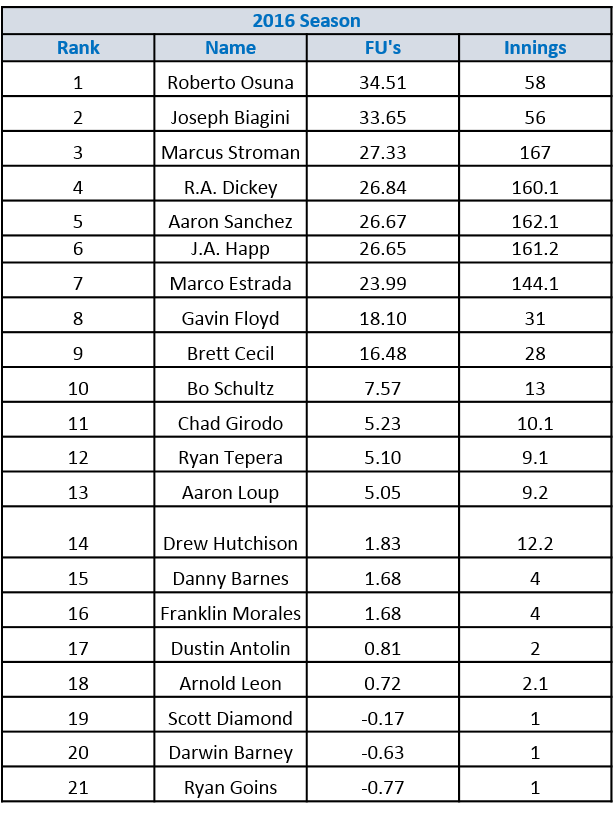
Catering to my Blue Jays friends, Roberto Osuna leads the team in FU’s, accumulating 34.5 on the season. He’s followed by Joe Biagini, with 33.6. Aaron Sanchez is at 26.7 on the season – which looks like it will be less than his 34.6 FU’s he accumulated during the 2015 season. Here are the Blue Jays cumulative FUs for the 2015, and 2016 seasons, respectively.

2015 jays

2016 jays

As with any metrics, tinkering will happen over time. Interesting to note between the 2015 season – while Sanchez has had a reduction in workload, look at the increase seen by Marcus Stroman. He made his miraculous return in September last year, only accumulating 7.53 FU’s in 2015. This year, he’s at 27.33 FUs.

Giving a big FU to workload metrics in pitchers: Part 2 – Cumulative FUs

Read Part 1 to see how FUs are calculated for pitchers during their appearances.

As we have learned in many different ways that are not a lot of fun, both relief pitchers and starting pitchers can succumb to the effects of pitching. This makes the Pitcher Abuse Point scale not appropriate for relief pitchers (see this article on Baseball Prospectus – (Jazayerli, 1998)). Other research has pointed to measures like innings pitched as being a poor determinant of workload in pitchers (Karakolis paper). Pitching on consecutive days, high velocities, and total pitches have been identified as risk factors for injury – let’s try and combine them all into one metric.

Starting with the FUs I described in part 1, I took a shot at modelling fatigue in every game in the 2015 MLB season. I downloaded the PitchFX database, and extracted the number of pitches, batters faced, innings pitched, and total time for each inning, for every game. I broke this down by pitcher, game, and inning, and was left with an FU for each inning during each game. To get a cumulative FU for each game, I just added these inning FUs up for each pitcher.

Velocity has also been indicated as a risk factor for injury, and the source of greater UCL stress (Whiteside et al., (2016), Sonne (2016)). To add in the effect of high velocity, a scaling factor was created using the average velocity of 92.16 mph. The peak velocity during each appearance was scaled to this, creating a factor that ranged between 0.614, and 1.124. This value was multiplied by the FU in each inning to create a velocity scaled FU.

Whiteside et al., (2016) showed reduced time between appearances was a significant predictor of UCL injury. Furthermore, the paper on heart rate variability in pitchers illustrated there weas less HRV the day after an appearance – which returned to baseline after 4 days. To include this in the cumulative FU, if a pitcher appeared in 2 games, back to back, they had a multiplier of 5. If their last appearance was between 2 and 4 days ago, they had a multiplier of 3. If their last appearance was 5 days or greater, the multiplier was 1. The velocity scaled FU was then multiplied by the rest multiplier, giving a cumulative FU for each game. These game cumulative FUs were then all added together, giving a season FU for each pitcher.

I’ve included an example of one pitcher from the 2015 season that I feel shows a good example of how this metric can be used (and how I feel moving a pitcher from the starting rotation to the bullpen doesn’t necessarily help their arm). Aaron Sanchez started the 2015 season as a starter for the Blue Jays, but injuries forced him to the disabled list after his June 6th start. When he returned on July 25th, Sanchez pitched out of the bullpen. To relate this back to the Whiteside article, which indicated higher velocities and fewer days’ rest were significant predictors of injury, Aaron averaged a peak fastball velocity of 95.5 mph as a starter in 2015, and 97.3 mph as a reliever. The average time between appearances was 5.5 days as a starter, but 2.4 days as a reliever.

I’ve compared his numbers against those of David Price – a known workhorse who remained in the starting rotation for multiple teams all year long.
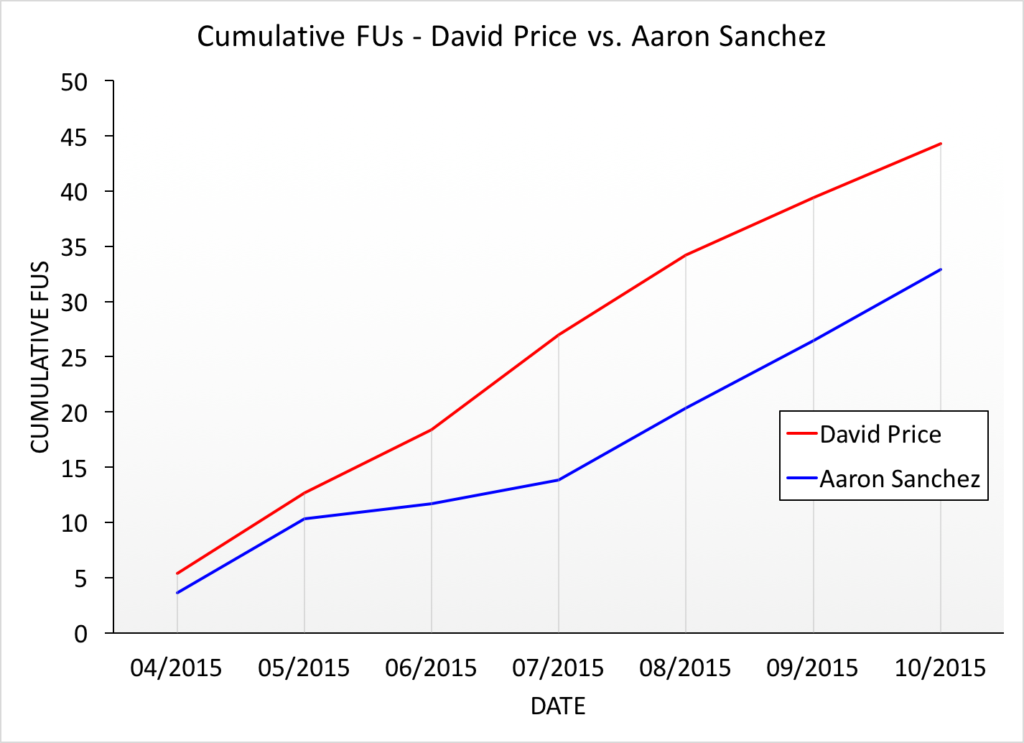
figure 1 - price vs sanchez

Figure 1. Aaron Sanchez and David Price’s cumulative FU workloads during the 2015 season.

Despite Sanchez being moved to the bullpen, you can see that his cumulative FU’s still increase over the course of the season. Sanchez missed nearly two months in the 2015 season – and this can be seen in the plateau between May and July. When he returns from the bullpen, his workload begins to increase again, and matches the increasing trajectory of FUs generated by Price.

Given the research reported by Whiteside et al., (2016), and inferred from the Motus data collected at Driveline  – I do not believe that Bullpen work should be viewed as a “break” from the starting rotation. There are unique demands associated with this type of pitching, and the workloads that the pitchers are subjected to when pitching in relief are not accurately captured by traditional metrics such as pitches thrown, or innings pitched. Let’s take a look at how Cumulative FU’s can capture the workloads of all major league pitchers from the 2015 season, and compare them back to the traditional metrics.

First, I wanted to see if the Cumulative FU was just a surrogate for IPs or pitches thrown – if it was, there is no point in using this metric! To do this, a Pearson correlation was used, and the R2 was calculated. Just as a note – this is not “innings pitched”, it represents “innings appeared in”. My thought process was – if a pitcher is coming out for an appearance, they perform the same warm up pitches, and bullpen work, regardless of how many outs they record. If a pitcher throws 30 pitches, while getting shellacked and does not record an out – this should still count towards the cumulative innings total on the season.

Cumulative FU’s were significantly correlated with other workload metrics, but not enough to believe they’re just a replication. After all, if you throw a lot of innings, that does represent a higher workload… it just may not capture the whole story. Looking at IP and total pitches, these measures explained 36.5% and 29.5% of the variance in cumulative FU’s, respectively. The number of outings in a season explained 65.2 % of the variance in cumulative FU’s, and the average number of days between appearances explained 27.9% of the variance in cumulative FU’s.

I examined the top workload pitchers for each of these metrics as well. I broke these metrics down by month of the season, so the cumulative workloads could be analyzed over time.
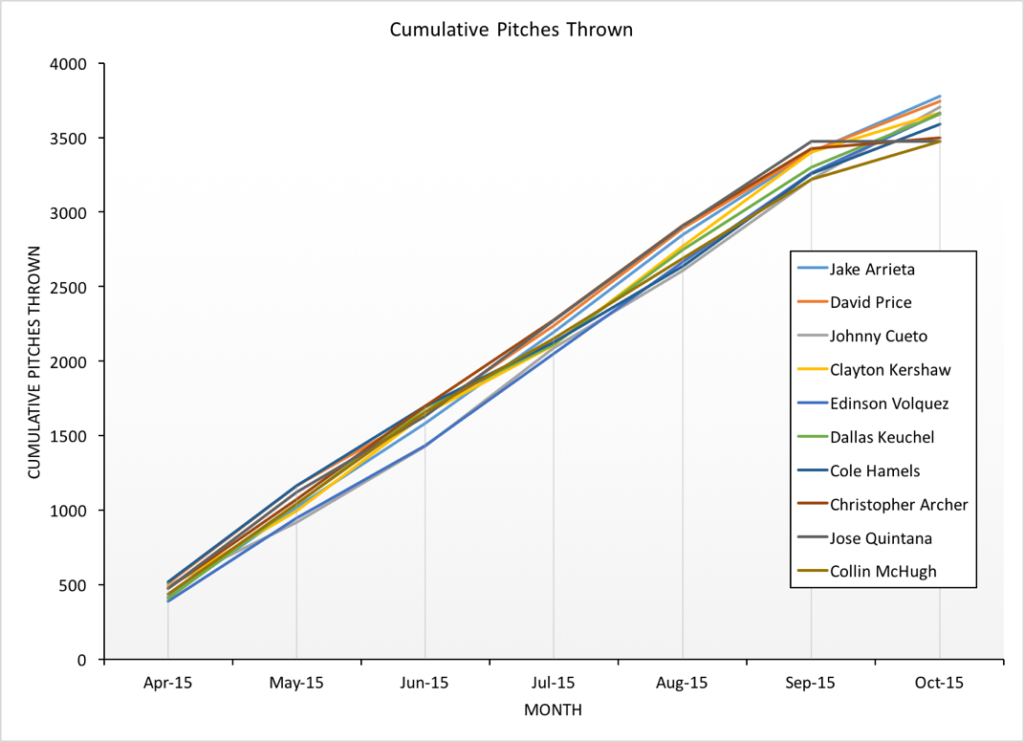
figure 3 - cumulative pitches

Figure 2. Cumulative Pitches Thrown during the 2015 season – top 10 pitchers. 
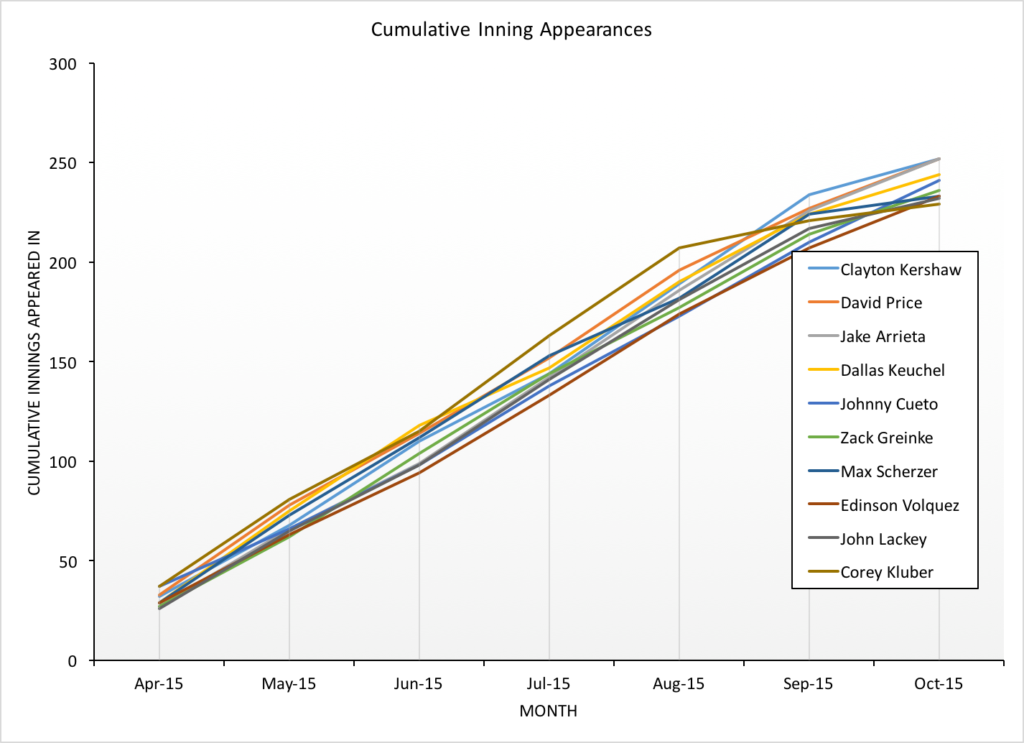
figure 2 - cumulative innings

Figure 3. Cumulative Inning Appearances in the 2015 season, broken down by month.figure 4 - cumulative fatigue units
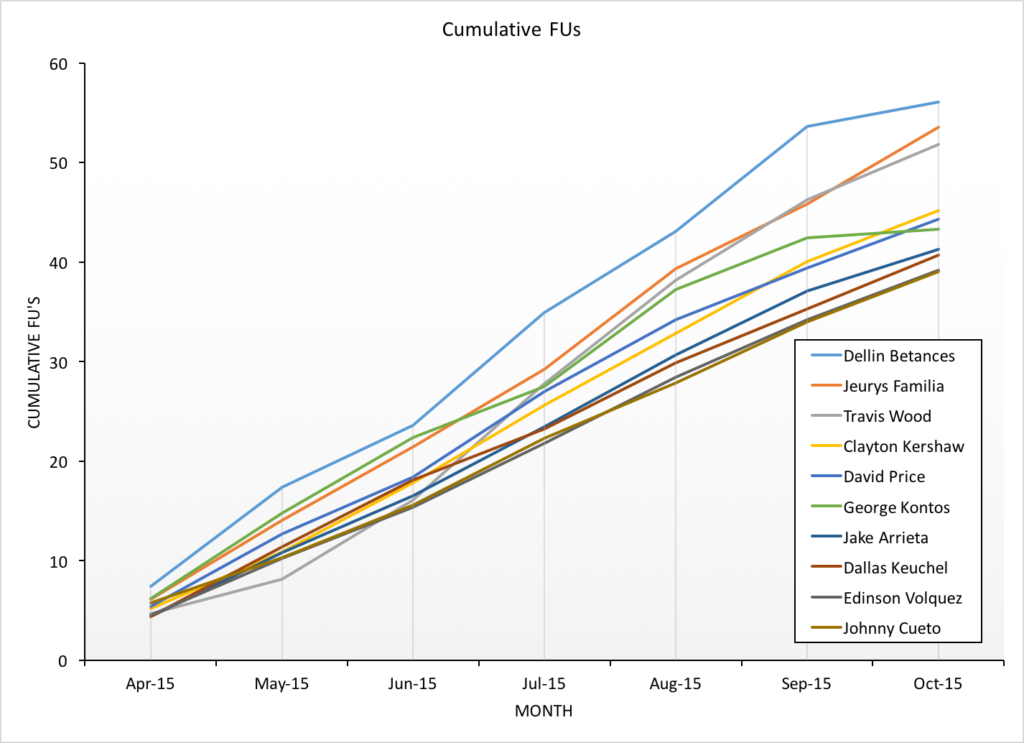
Figure 4. Cumulative FU’s for the 2015 season – top 10 pitcher workloads.

Once again, I don’t think it would surprise anyone to see Clayton Kershaw at the top of the innings pitched workload metric, or Jake Arrieta as the pitcher with the most total pitches thrown. These are both work horses for their respective teams. However, in both innings pitched, and total pitches, you will noticed that there are no relief pitchers.

Looking at cumulative FUs (Figure 4), Dellin Betances – he of 76 total game appearances, and Jeurys Familia (appearing in over 80 games for the Mets) appear at the top of the list. This is followed by Travis Wood (who appeared as both a reliever and a starter for the cubs), and finally, by Clayton Kershaw. Starters Price, Arrieta, Keuchel, Volquez and Cueto round out the list. This workload metric appears to show more favour for relievers, who appear on short rest schedules, often throw harder, appear in more games than starting pitchers.

Let’s look one step further, and see who has the highest workloads between the 2007 and 2015 seasons. First of all – who cumulatively had the highest workload during this time, and second – who had the highest average workloads during this time period.

Table 1. Top 10 for cumulative FU’s between 2007 and 2015 (in blue). Top 10 for average cumulative FU’s in a season between 2007 and 2015 (in red).

table 1 - cumulative fu's

Francisco Rodriguez has kind of run away with the cumulative FU crown – accumulating 366.19 FUs over the past 9 seasons. Serving as a closer – and surely, an elite closer, K-Rod has consistently averaged less than 3 days between appearances (on average, 2.7 days between appearances). Jonny Venters has the highest average season FU, at 49.64. His average days between appearances during those years with the Braves was 2.37. This is concerning, given his flame out of the major leagues due to injuries.

Depending on how you think about workload, these lists may surprise you. The overall cumulative workloads have half relievers, and half starters. The highest yearly averages all belong to relief pitchers, without a single starter in this list.

Even more concerning about the top seasonal workloads is the injury history of these pitchers – Venters and Manness needed Tommy John surgery after huge workload seasons, Trevor Rosenthal is down with a shoulder injury currently, and Belisaro flamed out of major league action. Carlos Marmol eventually lost all of his ability to throw strikes and is no longer on a major league roster. Even Francisco Rodriguez – who has remained relatively injury free (aside from a back injury) – is now throwing his fastball 5mph slower than he did in 2007. This is a legitimate concern for the number 3 pitcher on this list, the Blue Jays Roberto Osuna. As a teenager, Osuna had one Tommy John surgery – which is a risk factor for subsequent UCL reconstructions. Bear in mind – this list, and assessing workload with injuries, is completely anecdotal at this point. Much greater analysis is required to see if this workload metric is an indicator of injury potential.

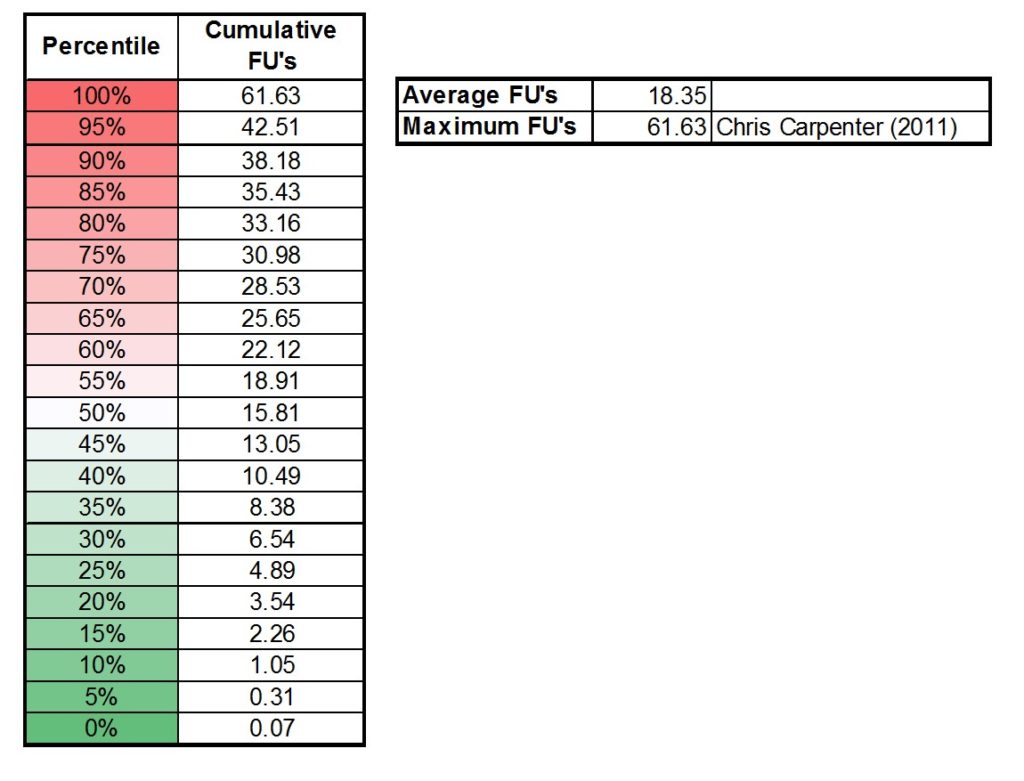
The next step – making this method easy to use, and finding out where threshold values lie. As for now, I can say based on these numbers – this is what different workload levels look like:
Picture2

From a pool of 1869 pitchers, over the span of 9 seasons, this is the range we are seeing for cumulative FU’s. The average FU in a season is 18.35, and the maximum is 61.63 – from the 2011 season, which proved to be Chris Carpenter’s final season as a full time, major league pitcher. If someone gets to a level of 40, you can consider that a very high workload season.

Like all metrics, there is a long way to go for us to understand what exactly all of these numbers mean.

If you have any feedback, or questions about this method – shoot me an email (michaelsonne@gmail.com), or send me a tweet @DrMikeSonne.

If you’re curious, here are the data for different workload metrics.

References

Karakolis, T., Bhan, S., & Crotin, R. L. (2015). Injuries to young professional baseball pitchers cannot be prevented solely by restricting number of innings pitched. J Sports Med Phys Fitness.

Jazayeril, R. (1998). Pitcher Abuse Points – A New Way to Measure Pitcher Abuse. Baseball Prospectus, published June 19, 1998. http://www.baseballprospectus.com/article.php?articleid=148

Whiteside, D., Martini, D. N., Lepley, A. S., Zernicke, R. F., & Goulet, G. C. (2016). Predictors of Ulnar Collateral Ligament Reconstruction in Major League Baseball Pitchers. The American journal of sports medicine, 0363546516643812.

Sonne, M. (2016). Pitching Velocity and its Effect on UCLE stress using the Motus Sleeve. Driveline Baseball Blog, posted July 27, 2016.

https://www.drivelinebaseball.com/2016/07/27/pitching-velocity-and-its-effect-on-ucl-stress-using-the-motus-sleeve/

O’Connell, M., Boddy, K. (2016). Can You Reduce Pitching Elbow Stress Using a Sleeve? Driveline Baseball Blog, posted July 20, 2016. https://www.drivelinebaseball.com/2016/07/20/can-reduce-pitching-elbow-stress-using-sleeve/

© 2024 Mike Sonne

Theme by Anders NorenUp ↑