Science and Baseball

Category: Ergonomics

A Theoretical Concern for Weighted Ball Training and Workload Reductions

I wanted to start this (the final post of 2016) off on a sappy note. This has been the first year that I’ve been involved in writing about baseball from a scientific perspective. When I started my PhD at McMaster, there was a department seminar meeting, which focused on science and knowledge translation. The speaker, who was a world leader in her field, told us that on average – research takes 14 years to make it from the lab to the field. I made it my focus to try and reduce those numbers. While my PhD had an ergonomics application, I have really enjoyed trying to tie the worlds of baseball and ergonomics together. Fatigue Units, and the fancy fatigue graphs, and the paper arguing against pitch clocks, all use the model I developed for my PhD thesis. If you have read anything I have written this year, I am eternally thankful! Interacting with people through Twitter, email, and this blog, has been one of the most fun and rewarding experiences I’ve had as a scientist. I really want to thank Dr. Stephen Osterer, Dr. Michael Chivers, Tavis Bruce, Kyle Boddy, Michael O’Connell, Trip Somers, Kevin Kennedy, and Eno Sarris for helping me get my ideas out there. You guys know so much more than me about baseball, but thanks for listening to me anyway!

Alright, enough of that – time for nerd stuff.

I’ve had a chance to look at Fleisig’s most recent paper 1 on arm forces during weighted ball training. This paper is a very important step towards determining the safety of a very effective method for pitcher development. If pitchers are getting better, but increasing their risk of injury – what’s the point in throwing harder? At the same time, maybe throwing these weighted implements serves as a unique stimulus for muscle growth and arm health. A lot of questions are still out there waiting to be answered, but this is an important first step.

So, let’s look at things as simply as we can. One of the first equations you learn in physics, or in the application of physics to the human body – biomechanics – is that force is equal to mass times acceleration.

F = M*A

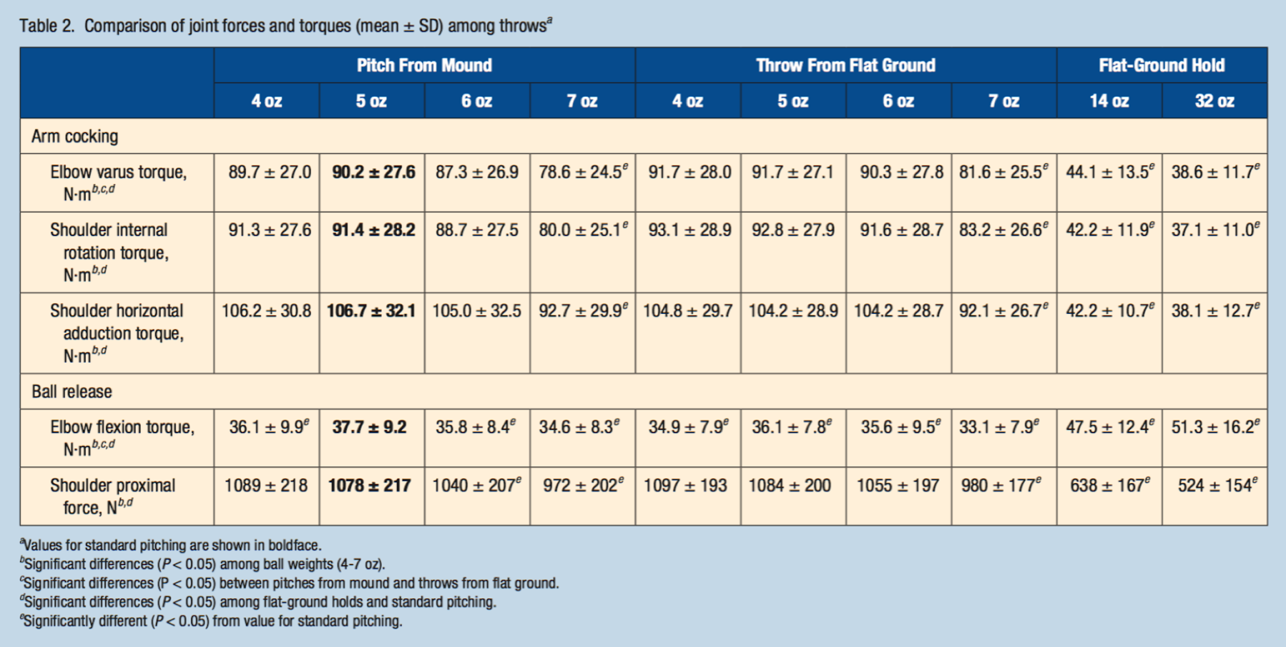
One of the main findings of this study, was overweight baseball throwing produced lower forces on the arm, primarily, lower varus torques when compared to normal weight baseballs. With respect to injury prevention, and specifically, Ulnar Collateral Ligament tears, this is a good thing! Lower varus torques mean less strain on the ligament, and a reduced risk of tearing when compared to the normal weight baseballs.

How does throwing something heavier result in less force in a joint? It all comes back to F = M*A. If we keep acceleration constant, and want to decrease force, we’d need to decrease the mass of the segment (and implement) being rotated. Similarly, if we wanted force to be lower, but increased the mass, we’d need to significantly reduce the acceleration of the segment. From table 1 in the Fleisig paper, we can see that the accelerations of the shoulder, elbow, and pelvis are all lower in the heavier ball conditions when compared to the underweight, and overweight baseballs.

fleisig-tbl-1 fleisig-tbl-2

However, the overall varus torque on the elbow, and the directly transmitted torque to the ligament may not be the same thing.

Werner et al., (1993) 2, illustrated that torques incurred at the elbow during the pitching motion are greater than the known torsional torques required to rupture the UCL. Muscle activation is used to transmit these forces off of the ligaments, and prevent damage to the UCL. This is why it is dangerous for the flexor-pronator muscles to become fatigued, and lose their ability to produce muscle force during pitching (Bruce & Andrews, 2014) 3.

Joint rotational stiffness refers to how rigid a joint is while it is moved 4. In the human body, stiffness is controlled by increasing the co-contraction of muscles spanning a joint. For example, activating the flexor muscles of the elbow (the biceps), as the elbow is rapidly extending (using the triceps). A stiffer joint (with more muscle activation) theoretically protects the ligaments by transmitting rotational torques from “passive” tissues (those tissues which are not contracting), to the “active” tissues (the muscles which are contracting). However, by increasing stiffness of a joint, the body loses the ability to produce high rotational accelerations and velocities.

Think about it as a whip – a thicker piece of rope can not rotate as quickly, and snap as violently as a thinner piece of rope. At the same time, the thinner rope is at a higher risk of fraying and breaking than a thicker rope. In the body, a joint with less stiffness can move faster, and more smoothly than a joint with more stiffness.

When throwing a heavier implement as hard as you can, there has to be more joint rotational stiffness in place to protect the ligaments. However, as the motion becomes more natural, and more familiar to the thrower, stiffness will decrease. This will result in a ball velocity increase, and possibly, a re-mapping of muscle activation patterns for throwing the ball when returning to a normal weight ball. If you want to get deeper into this, and the concept of stability, stiffness, and joint rotational impedance, check out the work from some really smart guys – Mike Holmes, and Joshua Cashaback.

Does throwing a weighted ball decrease the total varus force at the elbow, but increase the amount of force that is actually transmitted to the ligament? For the sake of arguments, let’s say this is true. How do pitchers manage to stay healthy, while throwing harder? One of the possible ways to protect the UCL is to make sure that muscles are able  to contract, and reduce the amount of force transmitted to the ligament. Putting in work in the weight room, and specifically, training the forearm muscles, could serve to cause hypertrophy, increasing the physiological cross sectional area of the muscle and allowing the muscle to pull with the same amount of absolute force, but at a lower effort level (associated with less muscle activation).

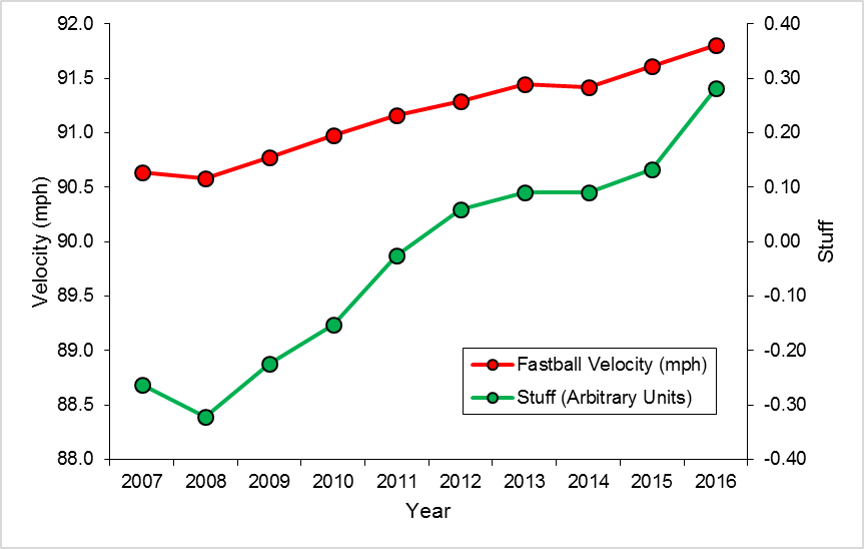
Research has shown there is very little effectiveness in restricting innings in pitchers with respect to preventing injury (Karakolis et al., 2016 5 ). Other research has shown that pitching velocity (and “Stuff” – sorry, shameless self-promotion) has increased linearly, year after year.

stuff-and-velocity

At the same time, the number of Tommy John Surgeries has also increased every year (particularly in younger pitchers) (Keri, 2015 6). Some people out there, who get their jollies on hoping people get hurt, so they can be proved right, even call this an epidemic.

keri-fleisig

(Figure from Keri, 2015).

 So, let’s bring my crazy, mad scientist, aluminum foil hat-wearing hypothesis full circle. Back to this theory on stiffness – pitchers are finding ways to shut off their muscles through different training regimes – yes, even maximizing your throwing intent to throw as hard as humanly possible, could play a role in reducing co-contraction and joint stiffness. Over the long term, could this be causing a re-mapping of the muscle firing patterns, reducing stiffness in game-thrown pitches, exposing the UCL to greater stress? Furthermore, do strict innings limits, like the ones that Matt Harvey and Stephen Strasburg faced, lead to a de-training effect? Pitching is a unique motion – one that is difficult to replicate in a gym. As a result, could there be atrophy occurring in the forearm musculature due to reductions in throwing? Fleisig’s paper hypothesized that the “holds” drill, and throwing of weighted baseballs, could be an effective resistance training strategy. Now imagine, hypertrophy occurs, allowing for protection of the UCL during high velocity throws. This happens in the offseason, when pitchers are preparing for their next year of competitive baseball. They throw frequently, with the intent of getting better. Now, they enter the MLB season, and arbitrary limits are placed on their pitching. To stay in the major leagues, they have to keep their velocity high – but now, they have lost some of that muscle mass they grew during their training. When they return to throwing – the velocity remains the same, but the protective mechanisms are now reduced.

This isn’t meant to be a stance for or against weighted balls. I don’t coach baseball – I’m a fan of the game, and truly enjoy applying what I know about how people move to the game I passionately watch. Keep in mind, this post is a perspective – it is not tested, or even extensively researched. Selfishly, I like writing these things, because there are people out there who have the access to pitchers, equipment, and can answer these types of questions. Consider this – a challenge point to unlock more information about how the body works. If you are using this as some form of gospel to take a stand against weighted balls – don’t do that. Don’t be a dick.

So, that’s my theory on how using weighted baseballs for training, and pairing it with workload restrictions in season, could lead to an increase in UCL injuries.

It’s either that, or it’s aliens.

1gfh0b

1.
Fleisig G, Diffendaffer A, Aune K, Ivey B, Laughlin W. Biomechanical Analysis of Weighted-Ball Exercises for Baseball Pitchers. Sports Health. November 2016. [PubMed]
2.
Werner S, Fleisig G, Dillman C, Andrews J. Biomechanics of the elbow during baseball pitching. J Orthop Sports Phys Ther. 1993;17(6):274-278. [PubMed]
3.
Bruce J, Andrews J. Ulnar collateral ligament injuries in the throwing athlete. J Am Acad Orthop Surg. 2014;22(5):315-325. [PubMed]
4.
Holmes M, Keir P. Posture and hand load alter muscular response to sudden elbow perturbations. J Electromyogr Kinesiol. 2012;22(2):191-198. [PubMed]
5.
Karakolis T, Bhan S, Crotin R. Injuries to young professional baseball pitchers cannot be prevented solely by restricting number of innings pitched. J Sports Med Phys Fitness. 2016;56(5):554-559. [PubMed]
6.
Keri J. The Tommy John Epidemic: What’s Behind the Rapid Increase of Pitchers Undergoing Elbow Surgery? Grantland. http://grantland.com/the-triangle/tommy-john-epidemic-elbow-surgery-glenn-fleisig-yu-darvish/. Published March 10, 2015. Accessed December 22, 2016.

Giving a big FU to workload metrics in pitchers: Part 2b – Cumulative FUs from FanGraphs

To calculate individual game FU’s, you’ll have to download the pitchFx database. However, if you want to get an idea of how much fatigue a pitcher has accumulated during a season, there is an easier way.

I investigated how well Cumulative FU’s lined up with data I downloaded from FanGraphs from the 2015 season – particularly, the amount of Innings pitched, the pace of pitching, number of relief innings pitched, and total pitches thrown. Using a linear regression approach, I then figured out what the right coefficients would be to predict the cumulative FU’s. Here are the results:

table for regression

regression for cumulative FU's

Overall, the R2 value was 0.95, and the RMS error was 3.0 Cumulative FU’s. Not too bad. Looking a bit more specifically, relief innings pitched was the most significant individual predictor, at R2 = 0.43. The combined variables produce the most accurate replication of the Cumulative FU metric.

If you want to use this to estimate workload in pitchers, the formula is: Cumulative FU’s =-3.38 + 0.10 * IP + 0.43 * Relief IP + 0.12 * Pace + 0.004 * Pitches.

With all of this in mind – now, let’s take a look at some 2016 data.

I went on the FanGraphs site, and generated a custom report with IP, Pitches, Relief IP, and Pace included.

Once again, the list ends up being fairly reliever heavy. Erasmo Ramirez has the highest workload so far this season, with at total of 44.38 FU’s. The first starter that appears on the list is Christopher Devenski at number 2 – but he has started 25 out of his 93.1 innings have come as a starter. The first dedicated starter on this list is Trevor Bauer, all the way down at 62. Once again, he has pitched out of the bullpen at times this season. With only starting innings showing up, Justin Verlander is at 72, accumulating 32.3 FU’s on the season.

Catering to my Blue Jays friends, Roberto Osuna leads the team in FU’s, accumulating 34.5 on the season. He’s followed by Joe Biagini, with 33.6. Aaron Sanchez is at 26.7 on the season – which looks like it will be less than his 34.6 FU’s he accumulated during the 2015 season. Here are the Blue Jays cumulative FUs for the 2015, and 2016 seasons, respectively.

2015 jays

2016 jays

As with any metrics, tinkering will happen over time. Interesting to note between the 2015 season – while Sanchez has had a reduction in workload, look at the increase seen by Marcus Stroman. He made his miraculous return in September last year, only accumulating 7.53 FU’s in 2015. This year, he’s at 27.33 FUs.

Giving a big FU to workload metrics in pitchers: Part 2 – Cumulative FUs

Read Part 1 to see how FUs are calculated for pitchers during their appearances.

As we have learned in many different ways that are not a lot of fun, both relief pitchers and starting pitchers can succumb to the effects of pitching. This makes the Pitcher Abuse Point scale not appropriate for relief pitchers (see this article on Baseball Prospectus – (Jazayerli, 1998)). Other research has pointed to measures like innings pitched as being a poor determinant of workload in pitchers (Karakolis paper). Pitching on consecutive days, high velocities, and total pitches have been identified as risk factors for injury – let’s try and combine them all into one metric.

Starting with the FUs I described in part 1, I took a shot at modelling fatigue in every game in the 2015 MLB season. I downloaded the PitchFX database, and extracted the number of pitches, batters faced, innings pitched, and total time for each inning, for every game. I broke this down by pitcher, game, and inning, and was left with an FU for each inning during each game. To get a cumulative FU for each game, I just added these inning FUs up for each pitcher.

Velocity has also been indicated as a risk factor for injury, and the source of greater UCL stress (Whiteside et al., (2016), Sonne (2016)). To add in the effect of high velocity, a scaling factor was created using the average velocity of 92.16 mph. The peak velocity during each appearance was scaled to this, creating a factor that ranged between 0.614, and 1.124. This value was multiplied by the FU in each inning to create a velocity scaled FU.

Whiteside et al., (2016) showed reduced time between appearances was a significant predictor of UCL injury. Furthermore, the paper on heart rate variability in pitchers illustrated there weas less HRV the day after an appearance – which returned to baseline after 4 days. To include this in the cumulative FU, if a pitcher appeared in 2 games, back to back, they had a multiplier of 5. If their last appearance was between 2 and 4 days ago, they had a multiplier of 3. If their last appearance was 5 days or greater, the multiplier was 1. The velocity scaled FU was then multiplied by the rest multiplier, giving a cumulative FU for each game. These game cumulative FUs were then all added together, giving a season FU for each pitcher.

I’ve included an example of one pitcher from the 2015 season that I feel shows a good example of how this metric can be used (and how I feel moving a pitcher from the starting rotation to the bullpen doesn’t necessarily help their arm). Aaron Sanchez started the 2015 season as a starter for the Blue Jays, but injuries forced him to the disabled list after his June 6th start. When he returned on July 25th, Sanchez pitched out of the bullpen. To relate this back to the Whiteside article, which indicated higher velocities and fewer days’ rest were significant predictors of injury, Aaron averaged a peak fastball velocity of 95.5 mph as a starter in 2015, and 97.3 mph as a reliever. The average time between appearances was 5.5 days as a starter, but 2.4 days as a reliever.

I’ve compared his numbers against those of David Price – a known workhorse who remained in the starting rotation for multiple teams all year long.

figure 1 - price vs sanchez

Figure 1. Aaron Sanchez and David Price’s cumulative FU workloads during the 2015 season.

Despite Sanchez being moved to the bullpen, you can see that his cumulative FU’s still increase over the course of the season. Sanchez missed nearly two months in the 2015 season – and this can be seen in the plateau between May and July. When he returns from the bullpen, his workload begins to increase again, and matches the increasing trajectory of FUs generated by Price.

Given the research reported by Whiteside et al., (2016), and inferred from the Motus data collected at Driveline  – I do not believe that Bullpen work should be viewed as a “break” from the starting rotation. There are unique demands associated with this type of pitching, and the workloads that the pitchers are subjected to when pitching in relief are not accurately captured by traditional metrics such as pitches thrown, or innings pitched. Let’s take a look at how Cumulative FU’s can capture the workloads of all major league pitchers from the 2015 season, and compare them back to the traditional metrics.

First, I wanted to see if the Cumulative FU was just a surrogate for IPs or pitches thrown – if it was, there is no point in using this metric! To do this, a Pearson correlation was used, and the R2 was calculated. Just as a note – this is not “innings pitched”, it represents “innings appeared in”. My thought process was – if a pitcher is coming out for an appearance, they perform the same warm up pitches, and bullpen work, regardless of how many outs they record. If a pitcher throws 30 pitches, while getting shellacked and does not record an out – this should still count towards the cumulative innings total on the season.

Cumulative FU’s were significantly correlated with other workload metrics, but not enough to believe they’re just a replication. After all, if you throw a lot of innings, that does represent a higher workload… it just may not capture the whole story. Looking at IP and total pitches, these measures explained 36.5% and 29.5% of the variance in cumulative FU’s, respectively. The number of outings in a season explained 65.2 % of the variance in cumulative FU’s, and the average number of days between appearances explained 27.9% of the variance in cumulative FU’s.

I examined the top workload pitchers for each of these metrics as well. I broke these metrics down by month of the season, so the cumulative workloads could be analyzed over time.

figure 3 - cumulative pitches

Figure 2. Cumulative Pitches Thrown during the 2015 season – top 10 pitchers. 

figure 2 - cumulative innings

Figure 3. Cumulative Inning Appearances in the 2015 season, broken down by month.figure 4 - cumulative fatigue units

Figure 4. Cumulative FU’s for the 2015 season – top 10 pitcher workloads.

Once again, I don’t think it would surprise anyone to see Clayton Kershaw at the top of the innings pitched workload metric, or Jake Arrieta as the pitcher with the most total pitches thrown. These are both work horses for their respective teams. However, in both innings pitched, and total pitches, you will noticed that there are no relief pitchers.

Looking at cumulative FUs (Figure 4), Dellin Betances – he of 76 total game appearances, and Jeurys Familia (appearing in over 80 games for the Mets) appear at the top of the list. This is followed by Travis Wood (who appeared as both a reliever and a starter for the cubs), and finally, by Clayton Kershaw. Starters Price, Arrieta, Keuchel, Volquez and Cueto round out the list. This workload metric appears to show more favour for relievers, who appear on short rest schedules, often throw harder, appear in more games than starting pitchers.

Let’s look one step further, and see who has the highest workloads between the 2007 and 2015 seasons. First of all – who cumulatively had the highest workload during this time, and second – who had the highest average workloads during this time period.

Table 1. Top 10 for cumulative FU’s between 2007 and 2015 (in blue). Top 10 for average cumulative FU’s in a season between 2007 and 2015 (in red).

table 1 - cumulative fu's

Francisco Rodriguez has kind of run away with the cumulative FU crown – accumulating 366.19 FUs over the past 9 seasons. Serving as a closer – and surely, an elite closer, K-Rod has consistently averaged less than 3 days between appearances (on average, 2.7 days between appearances). Jonny Venters has the highest average season FU, at 49.64. His average days between appearances during those years with the Braves was 2.37. This is concerning, given his flame out of the major leagues due to injuries.

Depending on how you think about workload, these lists may surprise you. The overall cumulative workloads have half relievers, and half starters. The highest yearly averages all belong to relief pitchers, without a single starter in this list.

Even more concerning about the top seasonal workloads is the injury history of these pitchers – Venters and Manness needed Tommy John surgery after huge workload seasons, Trevor Rosenthal is down with a shoulder injury currently, and Belisaro flamed out of major league action. Carlos Marmol eventually lost all of his ability to throw strikes and is no longer on a major league roster. Even Francisco Rodriguez – who has remained relatively injury free (aside from a back injury) – is now throwing his fastball 5mph slower than he did in 2007. This is a legitimate concern for the number 3 pitcher on this list, the Blue Jays Roberto Osuna. As a teenager, Osuna had one Tommy John surgery – which is a risk factor for subsequent UCL reconstructions. Bear in mind – this list, and assessing workload with injuries, is completely anecdotal at this point. Much greater analysis is required to see if this workload metric is an indicator of injury potential.

The next step – making this method easy to use, and finding out where threshold values lie. As for now, I can say based on these numbers – this is what different workload levels look like:

Picture2

From a pool of 1869 pitchers, over the span of 9 seasons, this is the range we are seeing for cumulative FU’s. The average FU in a season is 18.35, and the maximum is 61.63 – from the 2011 season, which proved to be Chris Carpenter’s final season as a full time, major league pitcher. If someone gets to a level of 40, you can consider that a very high workload season.

Like all metrics, there is a long way to go for us to understand what exactly all of these numbers mean.

If you have any feedback, or questions about this method – shoot me an email (michaelsonne@gmail.com), or send me a tweet @DrMikeSonne.

If you’re curious, here are the data for different workload metrics.

References

Karakolis, T., Bhan, S., & Crotin, R. L. (2015). Injuries to young professional baseball pitchers cannot be prevented solely by restricting number of innings pitched. J Sports Med Phys Fitness.

Jazayeril, R. (1998). Pitcher Abuse Points – A New Way to Measure Pitcher Abuse. Baseball Prospectus, published June 19, 1998. http://www.baseballprospectus.com/article.php?articleid=148

Whiteside, D., Martini, D. N., Lepley, A. S., Zernicke, R. F., & Goulet, G. C. (2016). Predictors of Ulnar Collateral Ligament Reconstruction in Major League Baseball Pitchers. The American journal of sports medicine, 0363546516643812.

Sonne, M. (2016). Pitching Velocity and its Effect on UCLE stress using the Motus Sleeve. Driveline Baseball Blog, posted July 27, 2016.

https://www.drivelinebaseball.com/2016/07/27/pitching-velocity-and-its-effect-on-ucl-stress-using-the-motus-sleeve/

O’Connell, M., Boddy, K. (2016). Can You Reduce Pitching Elbow Stress Using a Sleeve? Driveline Baseball Blog, posted July 20, 2016. https://www.drivelinebaseball.com/2016/07/20/can-reduce-pitching-elbow-stress-using-sleeve/

© 2024 Mike Sonne

Theme by Anders NorenUp ↑