Welcome to the bi-weekly Stuff report! I plan on posting this every 2 weeks to show off the Stuff metric (http://www.mikesonne.ca/baseball/22/), and answer the age-old argument – who has the best Stuff in baseball.
What is Stuff?
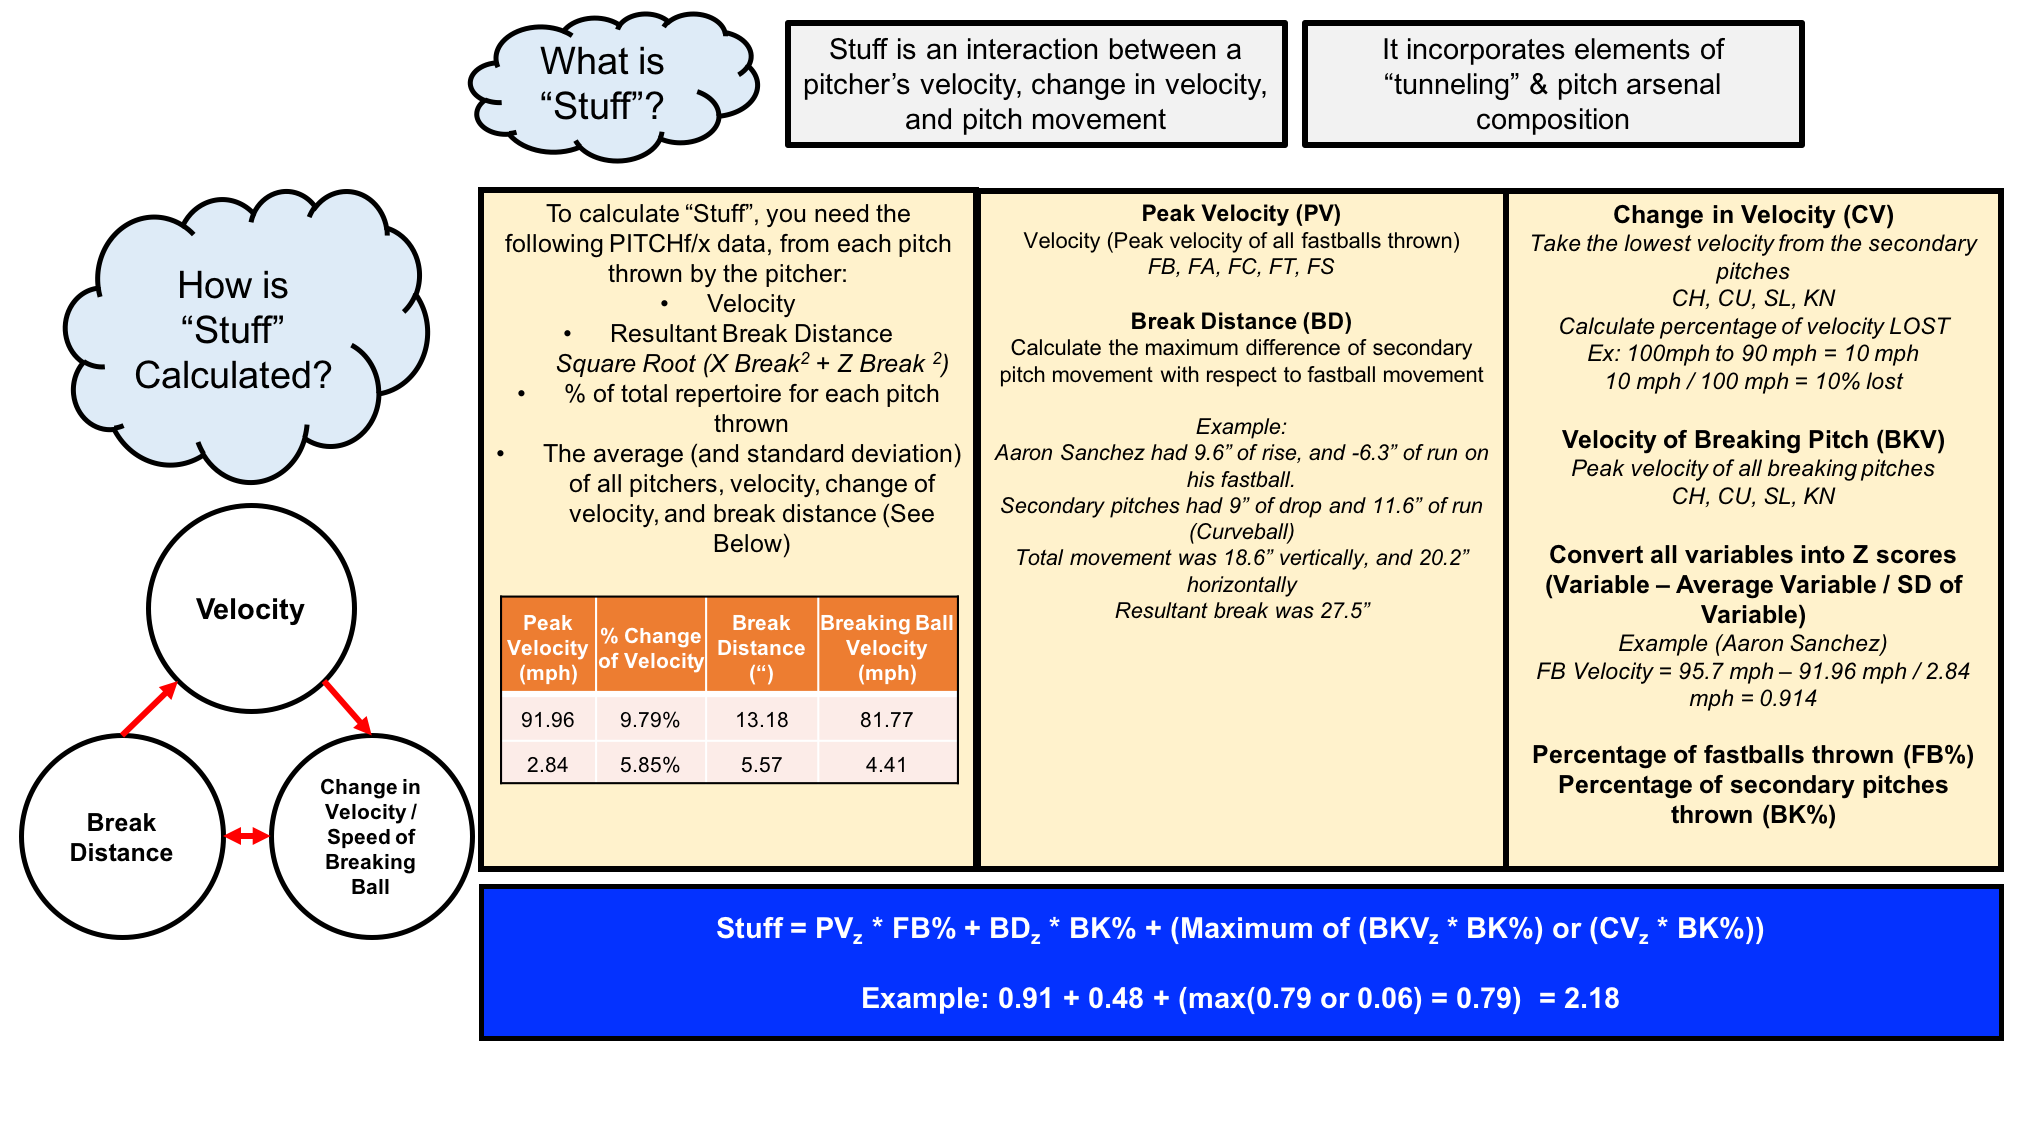
Stuff is an interaction between velocity, pitch usage, pitch movement, and change of velocity. Previous articles on the development of the stuff equation have found that it is significantly correlated with both K/9, WAR, and xFIP/ERA. The benefit of using the Stuff metric, is you could theoretically look at a pitcher’s arsenal in a bullpen session, and with the use of radar guns and spin trackers, could calculate their stuff. This has implications for both scouting, and rehabilitation.
How is Stuff calculated?
How to interpret Stuff
These rankings are filtered in descending order, from the best stuff in the MLB to the worst. I have presented the raw values that went into the calculation (because these are more fun to look at than the z-scores). I have also provided the percentile for stuff – which is from 0 to 100%. If a pitcher has 95% stuff, that means that their stuff is better than 95% of all other major league pitchers. Percentiles are blocked in 1% increments, so that is why you may see more than 1 – 100% stuff pitchers.
Enjoy! Feel free to use these numbers on your site, your Twitter, or in arguments with your friends at the bar. Remember, it’s always better to win your arguments with science.
The Best Stuff
Starting Pitchers
Note – Starting pitchers had to make as many starts as there have been weeks in the season to be included.
Starting Pitchers – By Team
Relief Pitchers
Note – Relief pitchers had to make as many appearances as there have been weeks in the season to be included.
Relief Pitchers by Team
That’s the stuff report for now! Feel free to comment, or use these numbers – just throw me a shout out.
Mike
Twitter – @DrMikeSonne
Dear Mike,
Excellent work, but I think it gives far too much weight to sheer velocity. Aaron Sanchez has great stuff, no doubt, but right now, if I had to pick between him and Marco Estrada to pitch one game for me, it’s Marco all the way.
Dickey comes across as completely useless by this metric, yet he no-hit Boston for five innings on Sunday, and has been very good in all but two outings this year.
If you’re trying to figure out who’s better between flamethrowers, this is a great way to do it. To evaluate pitchers who changes speeds a lot without great velocity, or knuckleballers, it’s close to useless, IMHO. If you prefaced your analysis with that caveat, that would be fair.
Keep in mind that original intention of this metric… To quantify something that is constantly mentioned by colour commentators, which, has typically talked about speed and movement on pitchers. Take a look on the internet – there aren’t many people talking about how great Estrada’s stuff is, but there are a lot that praise the stuff of Pawtuckett’s Joe Kelly.
And yeah – it doesn’t do a good job with Knuckleballers. There are currently 528 players who have thrown a pitch in 2016 (according to fangraphs), and this metric is useful to 526 of them. Not a bad ratio. Finally, you say that it’s useless for guys who don’t throw hard. I think it’s important to use stuff as a method of looking at when a player might be hurt. If they’re losing movement or velocity, their stuff will go down. This is helpful to compare agains the player’s own numbers and see what is happening.
Oh, and looking at the 528 pitchers from this season – This is how the numbers break down for who uses what part of the metric to drive their Stuff –
Fastball Velocity – 36%
Change of Speed – 22%
Break Distance – 25%
Breaking Ball Velocity – 17%
So, definitely not just rewarding the Flamethrowers.