In the bottom right corner of your screen, you see the number of outs, you see the score of the game, the inning number, and right at the top of that ticker – the number of pitches that the pitcher has thrown (Figure 1).

Figure 1. Tickers from various broadcasts, illustrating a bunch of information to make you feel more informed.
Pitch counts have been used as a metric to measure workload in pitchers for some time now. Broadcasters constantly speculate on when a starter will be removed from a game as they approach that insidious 100 pitch limit – but is it just as simple as counting up the number of times that a ball has been thrown?
Zack Rymer found those pitchers who averaged 100 pitches per start were not more likely to get injured. Tom Karakolis and his crew pointed to the same findings – pitch counts or innings pitched may not be the best method of measuring workload.
Earlier this season, Ross Stripling was pulled from a no-hitter because he came up against the 100 pitch limit. This limit, while based on an article by Whiteside and colleagues (Whiteside et al., 1999), does ignore the fact that throwing 100 pitches over a complete game is probably going to be a lot less stressful than pounding through 100 pitches over 5 innings. Dieter Kurtenbach (@dkurtenbach) wrote a great article surrounding the mystique of the 100 pitch limit, and illustrated a few other workload measures (like the pitcher abuse points). The main point from this article, is that all pitches cannot be considered equal, and drawing a hard line in the sand at 100 is probably not going to save elbows, or preserve young pitchers.
Using the same fatigue model that was used to show Pitch Clocks are going to elevate muscle fatigue in pitchers, I wanted to show how the 100 pitch limit is probably not our best metric for evaluating stress in pitchers.
Fatigue Modeling
The fatigue model I used for this analysis is published in the Journal of Ergonomics (Sonne & Potvin, 2016), and has been used to estimate fatigue levels in baseball pitchers. This model is based off of motor unit physiology. From Wikipedia:
“A motor unit is made up of a motor neuron and the skeletal muscle fibers innervated by that motor neuron’s axonal terminals. Groups of motor units often work together to coordinate the contractions of a single muscle; all of the motor units within a muscle are considered a motor pool”.
When a motor unit fires, all of the muscle fibres it innervates contract, and this causes a force to be generated. Motor units can be quite small and generate small amounts of force, or quite large and generate lots of force. At the same time, the amount of force that a motor unit can generate is impacted by the fatigued state that it is in. If a motor unit is exhausted, it cannot generate any force, and it will rely on other motor units to pick up the slack on its behalf. The order in which motor units join the good fight of force production is best described by the size principle, originally hypothesized by Henneman et al., (1965). The size principle states that smaller, less forceful motor units will be recruited first, and larger, more forceful motor units will be recruited once they are required.
We could talk about motor unit physiology for days and days, but I kind of want to write about baseball now.
The fatigue model I’m using defines fatigue as “a loss of force generating capacity”. If your muscle is 10% fatigued, that means, it can now generate only 90% of it’s pre-fatigued force. When you’re exercising, failure can occur once you’ve reach a certain amount of fatigue. From an injury perspective, the muscles used to protect your joints during movement can become fatigued, and lose some of their protective capacity.
So, to drive the model, I used the muscle demands of the forearm seen during the throwing of fastballs (DiGiovine et al., 1992, Glousman et al., 1992, Hamilton et al., 1996 Sisto et al., 1986) (Figure 2).
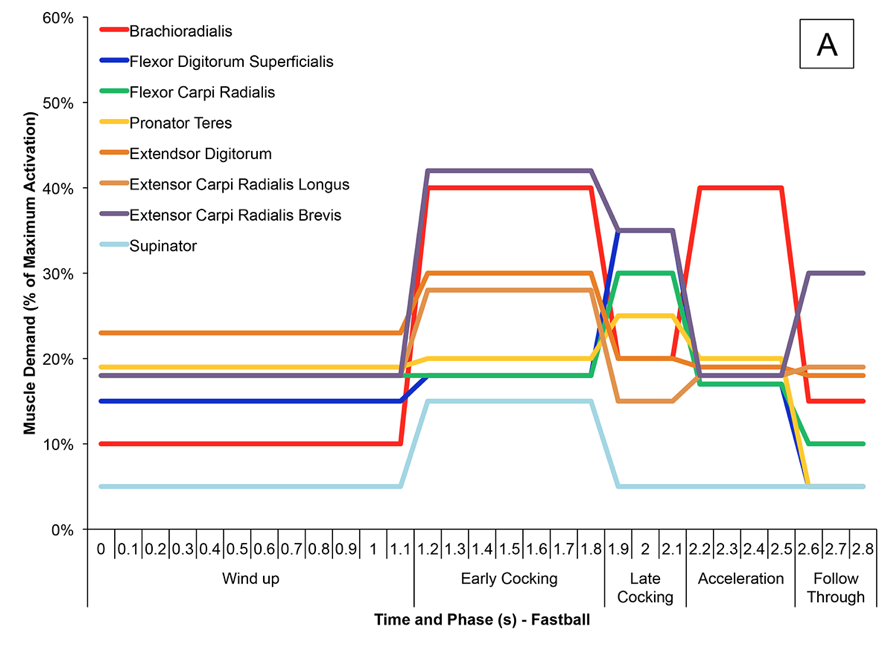
Figure 2. Muscle Activation levels, broken down by phase of throw, and grouped by individual forearm muscles.
I then assumed an average amount of rest between pitches (as per FanGraphs – the value used was 22.6 seconds). I assumed 2:30 of rest between innings, and simulated the offensive half of an inning as being 17 pitches long, with 22.6 of rest between each pitch.
To examine the effect of the 100 pitch limit, I simulated starts ranging between 4 and 9 innings, throwing only fastballs, but having the appropriate average of pitches per inning to get to that limit (4 inning start – 25 pitches per inning, 5 inning start – 20 pitches per inning, etc (I rounded to the nearest whole pitch). While I have calculated fatigue for individual muscles, I’m just going to graph out the average fatigue for all forearm muscles (for ease of viewing – Figure 3).
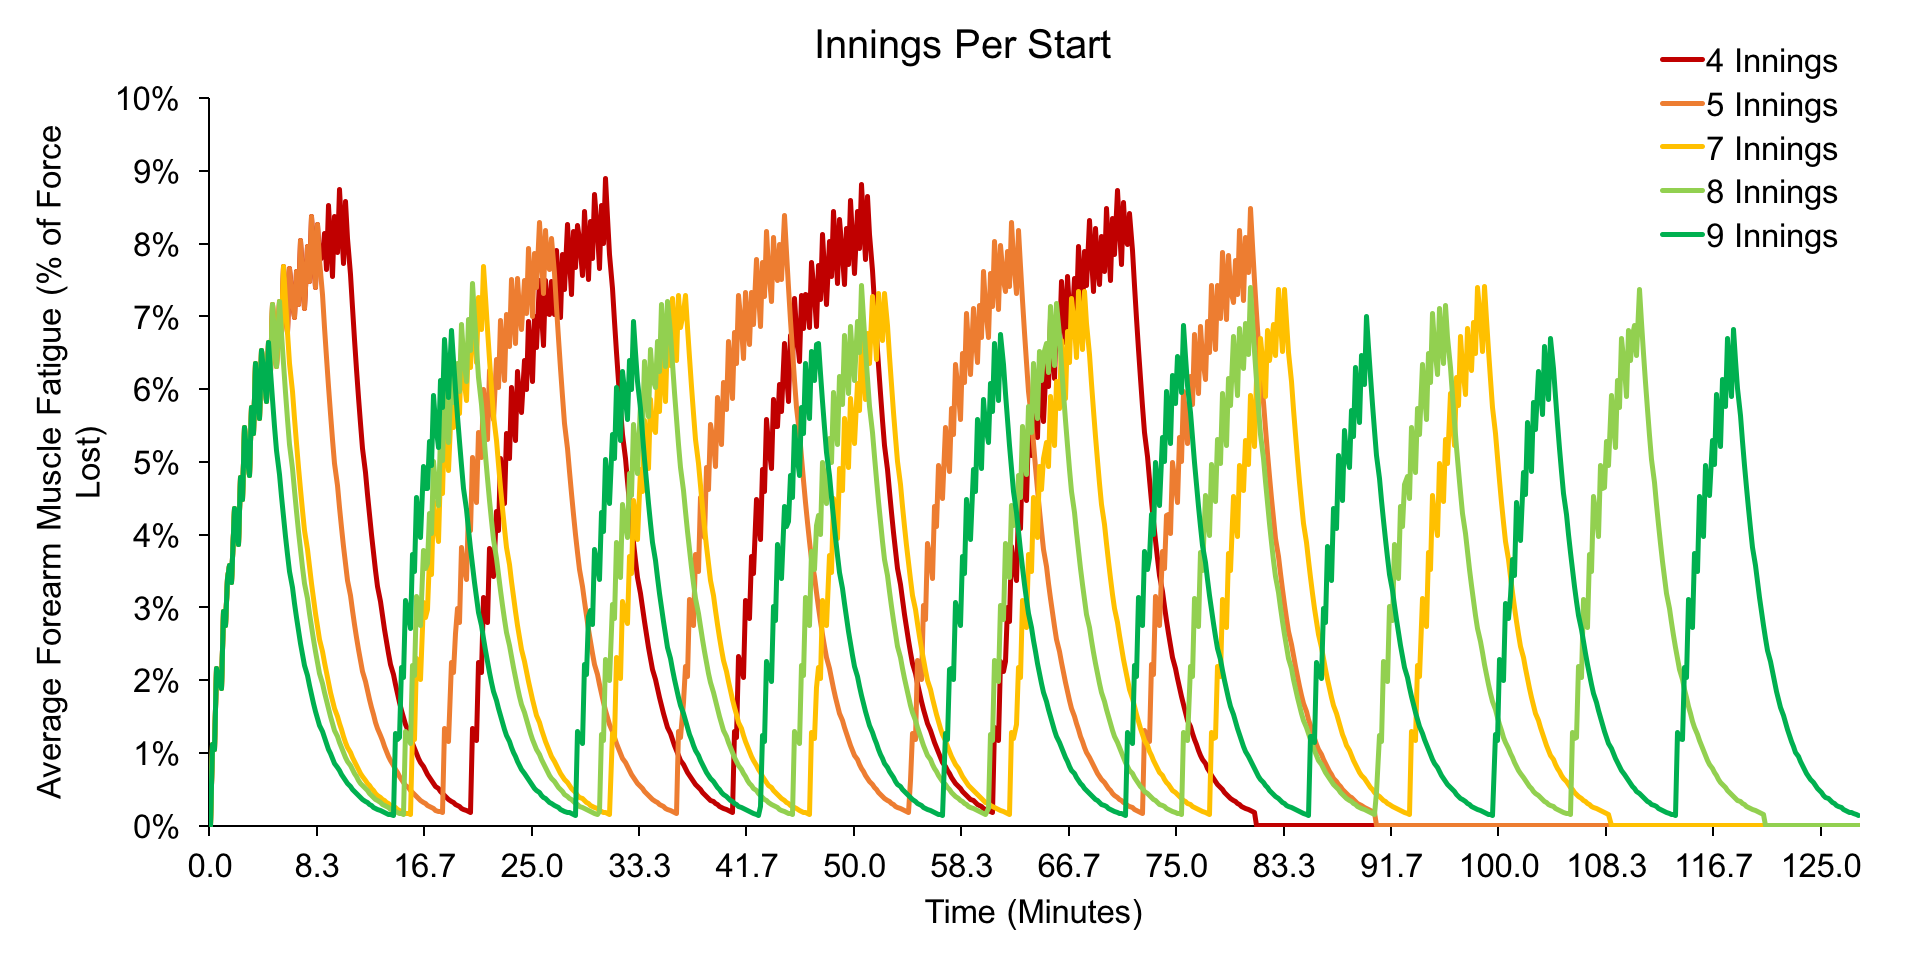
Figure 3. Average forearm muscle fatigue during starts of 4 to 9 innings, all with the same pitch count (100 pitches).
The major take home from this figure should be how high each of those lines gets on the Y Axis – the greener the line, the more innings per start – and more importantly, less fatigue per start. Chances are, if your starter has gone through 100 pitches in their first four innings, they’re likely going to get the hook. For the sake of this exercise, let’s take a look at how fatigue would change with respect to those 4, 25 pitch innings.

Figure 4. Change in fatigue compared to 4 inning start with 100 pitches – positive values indicate the level of fatigue reduction (ie, 5% represents 5% less fatigue when compared to the 4 inning start – a higher value means there is a greater benefit for fatigue reduction when throwing fewer pitches per inning).
A quality start is defined as 6 innings pitched, allowing 3 ER or less. If a pitcher throws 100 pitches in those 6 innings, they’ll see nearly 10% less fatigue in their forearm muscles when compared to a 4 inning start. Looking at a 100 pitch, complete game start, there is a benefit of nearly 20% compared to that 4 inning start. To see the benefits in individual forearm muscles, check out table 1.
Table 1. Fatigue levels in individual forearm muscles, and the improvement in fatigue compared to a 4 inning, 25 pitch start.
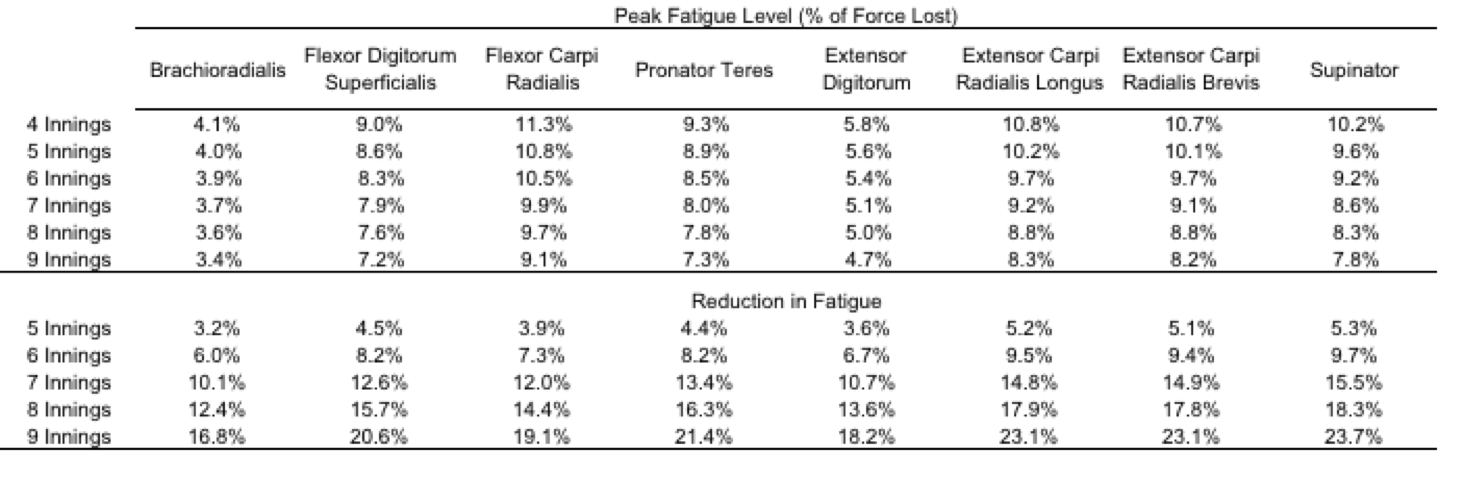
So, what does this all mean? A 100 pitch limit is rooted in science, but looking at pitch counts alone in the start do tend to miss the bigger picture – the amount of work done in an individual inning appears to induce more fatigue than looking at the total pitches performed in a start alone. Working deep into games and limiting the pitches in each inning is the most effective way of keeping muscle fatigue levels low.
Effective tools for fatigue monitoring are essential to pitcher health. If you’re looking for more insight into the topic, I highly recommend following guys like Ryan Faer and Kyle Boddy on Twitter. If you’re a coach and want to look at tools to measure workload in pitchers, a great place to start is this guide from the Baseball Performance Group.
If you want to learn more about the fatigue modeling process – check out the paper I wrote for the Journal of Sports Sciences here. I’m not saying use sci-hub to download it… but I’m also not saying not to.
References
DiGiovine, N. M., Jobe, F. W., Pink, M., & Perry, J. (1992). An electromyographic analysis of the upper extremity in pitching. Journal of Shoulder and Elbow Surgery, 1(1), 15-25.
Glousman, R. E., Barron, J., Jobe, F. W., Perry, J., & Pink, M. (1992). An electromyographic analysis of the elbow in normal and injured pitchers with medial collateral ligament insufficiency. The American Journal of Sports Medicine, 20(3), 311-317.
Hamilton, C. D., Glousman, R. E., Jobe, F. W., Brault, J., Pink, M., & Perry, J. (1996). Dynamic stability of the elbow: electromyographic analysis of the flexor pronator group and the extensor group in pitchers with valgus instability. Journal of Shoulder and Elbow Surgery, 5(5), 347-354.
Henneman, E., Somjen, G., & Carpenter, D. O. (1965). Functional significance of cell size in spinal motoneurons. Journal of neurophysiology,28(3), 560-580.
Sisto, D. J., Jobe, F. W., Moynes, D. R., & Antonelli, D. J. (1987). An electromyographic analysis of the elbow in pitching. The American journal of sports medicine, 15(3), 260-263.
Sonne, M. W., & Keir, P. J. (2016). Major League Baseball pace-of-play rules and their influence on predicted muscle fatigue during simulated baseball games. Journal of sports sciences, 1-9.
Sonne, M. W., & Potvin, J. R. (2016). A modified version of the three-compartment model to predict fatigue during submaximal tasks with complex force-time histories. Ergonomics, 59(1), 85-98.
0 Comments
1 Pingback