The Stuff report gets back on track! Let’s figure out who has the best Stuff in Major League Baseball.
In case you’ve forgotten, the Stuff metric was designed to help our friends in colour commentary with their commonly used cliche’s about what pitchers have great “stuff”. The metric looks at a pitcher’s ability to generate velocity, change in velocity, and break distance between their arsenal of pitches. The exact math can be found in the first stuff article, or throughout the rest of the Stuff reports on this site.
Let’s get into it.
Starting Pitchers
The leader of the pack remains Jake Arrieta, followed by Noah Syndergaard. However, all of the drama this week has centered around the ever climbing Aaron Sanchez – who is now up to #7 on the Stuff list. Aaron is being moved into the Blue Jays bullpen – where, his stuff will likely get better (his velocity increased from 95 to 97 last year when he was in the bullpen), but who knows about the long term implications for injury prevention. I’ve argued that moving to the bullpen probably doesn’t decrease stress on the arm. Leaving the rotation doesn’t help the Jays with their overall starting Stuff, that’s for sure – but take a look who is at the top of the list. Now, let’s look at relievers.
Relief Pitchers
There’s no surprise that Aroldis Chapman is leading the league in Stuff – he’s thrown the hardest pitch ever recorded.
However, a new challenger to the StatCast throne makes his first Stuff Report appearance – Mauricio Cabrera, with his 100mph average fastball falls in line just behind Chapman with Stuff of 2.24.
I mentioned earlier to look at the top of the team Stuff rankings – the Cubs sit number 1 for the starters. Well, they sit # 1 for the relievers. The Chicago Cubs are unequivocally, the kings of Stuff. They have a preeeeetty good team over there on the North Side.
Learning more about Stuff
A metric is only good if it is both reliable (it measures the same thing, over and over again), and valid (what it claims to be measuring is actually being measured). I’m sure there are a lot of people who have their own thoughts over how Stuff should be quantified – BUT THEY DIDN’T MAKE A WEBSITE ABOUT IT, SO HAH. I wanted to check out just how well the Stuff metric has performed this season.
Stability
My initial thoughts were that I had needed an entire season of data to make sure we got a reliable measure of Stuff – but then this season, I’ve been trying to write Stuff reports every 2 weeks (that hasn’t always worked out on www.mikesonne.ca, but you can find my Stuff reports on the Blue Jays over at Baseball Prospectus Toronto. In total, there have been 8 stuff reports since the start of the year, so let’s look at all of the starters and relievers who have appeared in each of them.
Overall, there were 110 Starting Pitchers who have registered stuff values in the 8 Volumes of the Stuff Report. There were 135 relief pitchers. The average (SE) Stuff for these starting pitchers was 0.50 +/- 0.08, and 0.51 +/- 0.08 for relievers. Over the course of those 8 reports, There has been a general decline in Stuff – with Stuff peaking for both starters and relievers in Volume 2, and gradually declining since.

Figure 1. Average (SE) Stuff for Starters and Relievers over the biweekly stuff reports since the start of the season.
With respect to the reliability of the metric – how much did a pitcher’s stuff change on a biweekly basis? I looked at all of the Starting and Relief pitchers who qualified, and I calculated the coefficient of variation of their Stuff (Standard Deviation / Average). For starting pitchers, the CV was 30%, and for relief pitchers, the CV was 22%. That was pretty shocking! I thought with the fewer number of pitches that a reliever throws, they would be much more variable – but that isn’t the case.
Now, how does the stuff metric continue to hold up against performance metrics – primarily, K/9 and bb/9. I looked at the average Stuff over the course of the season (calculated by taking the average of each of the 8 volumes – not the overall season average), and also, the average absolute coefficient of variation, and correlated these with K/9 and BB/9. Similar to previous evaluations of the metric, there was a moderate, positive correlation between stuff and K/9 for both starters and relievers (r = 0.35 for starters, and 0.30 for relievers). Looking at the variability of Stuff in starting pitchers – there’s a significant positive correlation between BB/9 and variability (r = 0.16), and a negative correlation between K/9 and variability (r = -0.26). The moral of that story? It appears if what is coming out of your hand is consistent, you may have an edge for striking people out, and you may have better control. Now, when looking at these variability measure in relief pitchers – the relationship disappears (an r of 0.02 for both BB/9 and K/9).
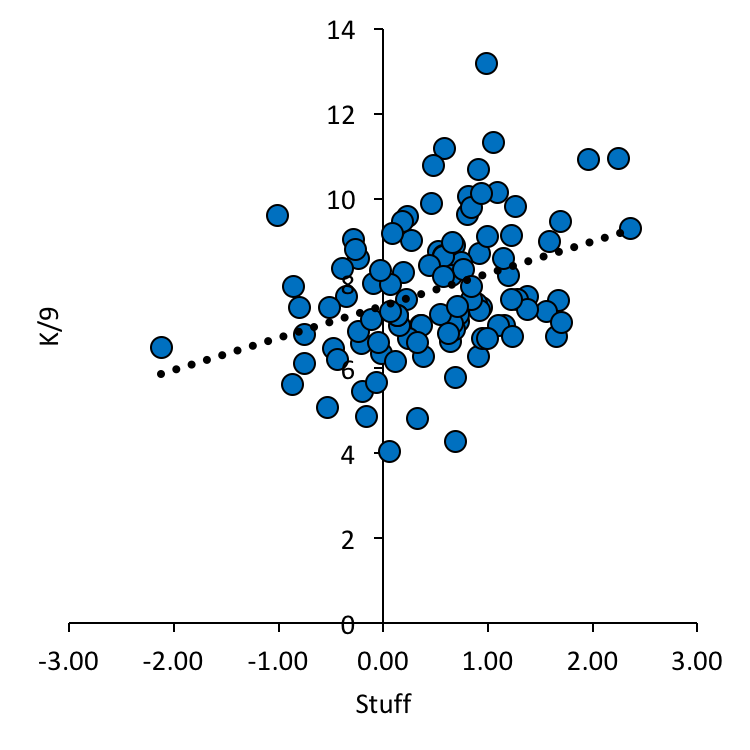
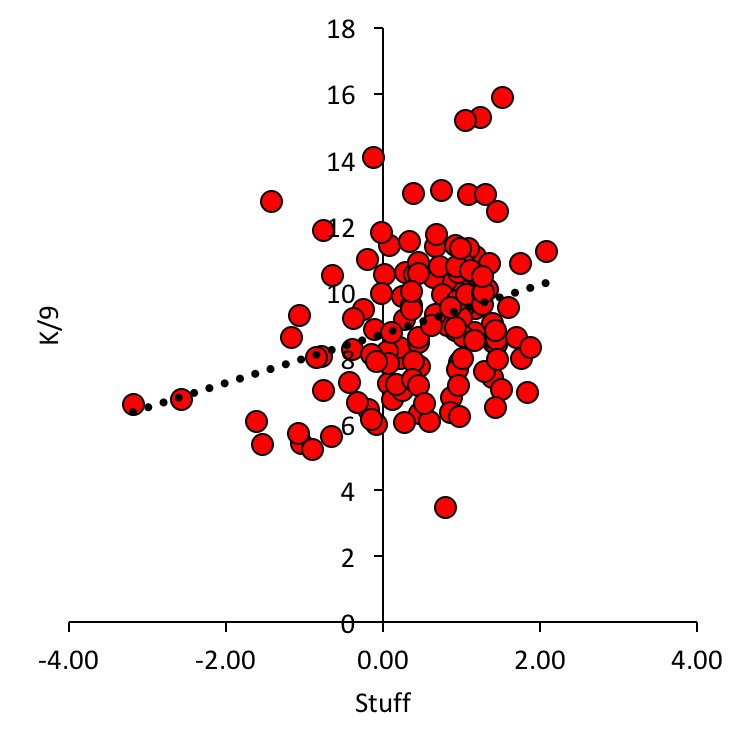
Figure 2 – Stuff vs. K/9 for Starters (Blue) and Relievers (Red).
I haven’t had a chance to look at it yet, but the next step is to see how Stuff changes as a response to injury. Here’s a graph of Brett Cecil’s stuff – he went on the DL a few months ago with a Lat tear. Also included is Marco Estrada – a starter who has had a bad back injury, and is likely fighting a trip to the DL. Finally, Aaron Sanchez – someone who has dominated and remained healthy all year.
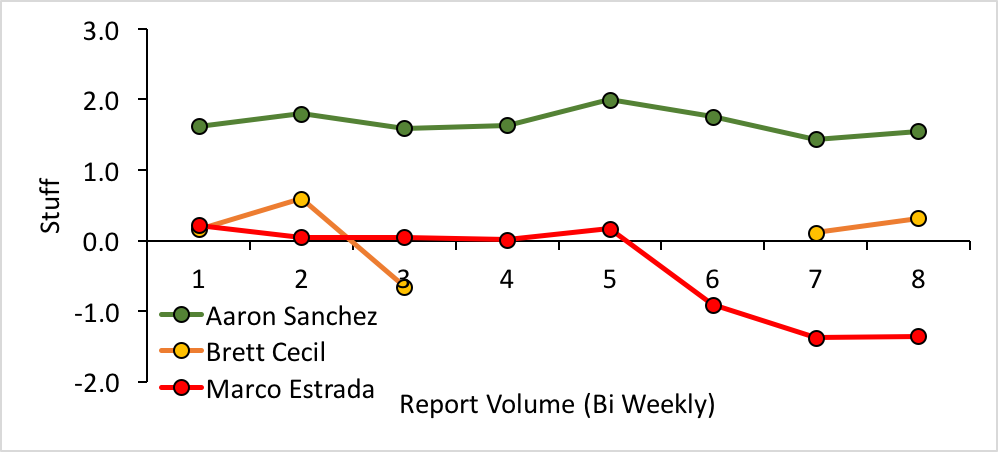
Figure 3 – How does Stuff change for pitchers who are healthy, pitchers fighting a stint on the DL, and pitchers who have missed time with an injury?
The Stuff metric was originally developed to quantify anecdotal claims about a pitcher’s repertoire, but I believe it has a lot more utility than that. Identifying workload and injury is the next step in Stuff.
Leave a Reply
You must be logged in to post a comment.